


🚨Key Highlights
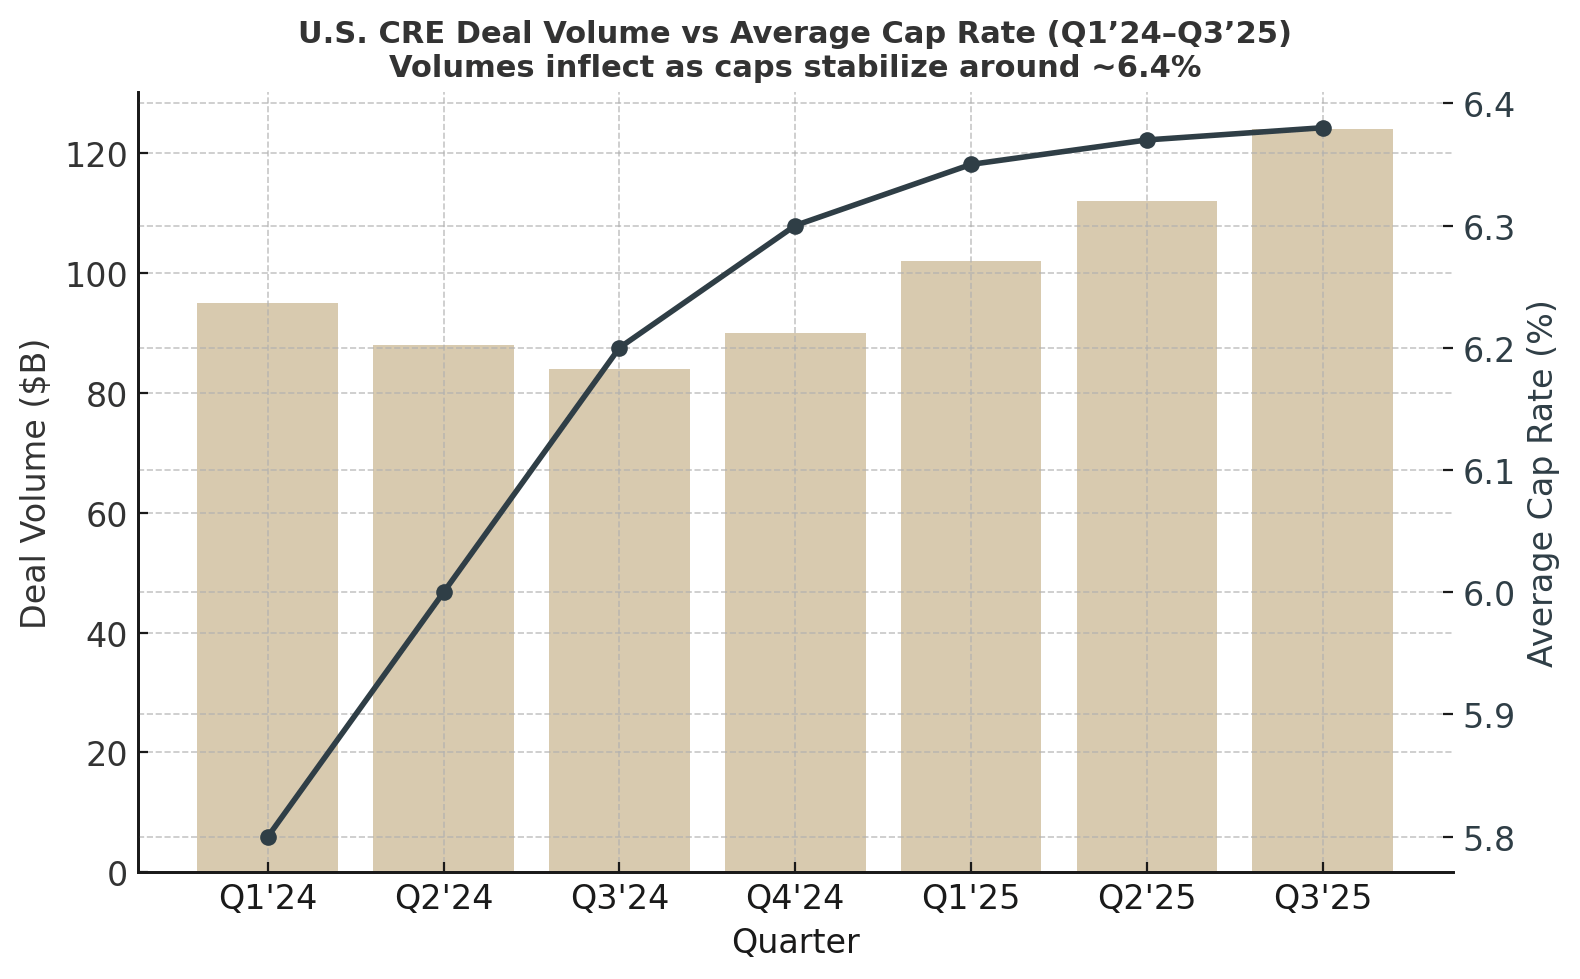
Q3 U.S. CRE sales prelim: $124B (+16% YoY); revisions point toward ~$140B (+30% YoY).
September volume ~$42B (+19% YoY); office up ~69% YoY, retail +28%, industrial +25%, hotel +15%; multifamily –5%.
MSCI tally corroborates a ~+17% Q3 jump, signaling a broad thaw.
10Y UST anchored ~4.0–4.3%; a potential Fed cut keeps risk appetite alive.
All-property cap near 6.4% with selective compression in industrial; bid-ask gap narrowing.
Signal
By late Q3, the market stopped waiting and started transacting. Preliminaries show $124B of U.S. CRE trades in Q3 (+16% YoY), with historical revision patterns pointing closer to ~$140B (+30% YoY). September was the pivot, adding ~19% YoY and a striking rebound in office from a depressed base. Data says liquidity returned; behavior says price discovery is largely done. Financing showed up, too—origination desks reported busier pipelines as buyers paired repriced equity with private-credit term sheets. The read-through for pricing: cap rates edged only modestly higher even as the 10-year held ~4%. Stability—rather than relief—is what got bought.
Where the volume came from
Office led the surprise with ~+69% YoY September volume as investors leaned into basis and business plans, not blue-sky rent growth. Retail and industrial posted broad +20–30% gains, consistent with steady cash flows and manageable new supply. Hotels followed with mid-teens growth as RevPAR visibility improved. Meanwhile, multifamily lagged (–5% YoY for September) amid ongoing lease-up pressure and outsized deliveries. The signal is rotation, not mania. As a result, underwriting realism—TIs, downtime, concessions—remained the gatekeeper for every bid that cleared.
Pricing: firm where income is credible
Sector cap prints converged near an all-property ~6.4% in late Q3, with industrial compressing into the low-6s as investors paid for durability and replacement-cost moats. Multifamily cap rates drifted higher into the mid-5s as operators absorbed supply and reset renewal strategies. This is not cap-rate beta; it’s income credibility. On balance, sellers met the market. That narrowed the bid-ask gap enough for deals to close without assuming rate relief. Still, the playbook favors cash-flow clarity over optionality.
Capital structures that cleared
Debt capital broadened beyond bank balance sheets. Private lenders competed on spread (≈ –25 bps vs midsummer quotes), while keeping tight structure: lower proceeds, quicker amortization, cash traps tied to DSCR. Banks showed selective appetite for stabilized cash flows. In practice, buyers solved for an 8–9% mortgage constant coverage with conservative exit caps. The tell: origination volumes ticked up in step with sales, and broker-dealer research now points to stronger capital-markets revenues at the global platforms. Ultimately, execution favored borrowers who arrived pre-papered.
Human scene
A Midtown investment committee room, 7:30 a.m.: asset managers pass around a fresh rent roll while a lender dials in. No one pitches cap-rate compression. Instead, the talk is “day-1 NOI, day-180 leasing, day-365 credit.” The model lands only when the operating plan does. That’s the market.
Guardrails for buyers
Update comps to today, not 2021: many sectors are +50–150 bps wider than peak. Target higher entry yields for office (8–9%+ where vacancy/retrofits loom). Lock rate cases around a 4.0–4.5% 10Y to avoid upside surprises. Underwrite flat/low growth in years 1–2, front-load capex and leasing, and sanity-check exits at entry cap +25 bps. For multifamily, carry 7–10% vacancy and ~2% rent growth until supply burns off; for industrial, temper rent CAGR to mid-single digits given pipeline; for office, assume generous TI/LC and zero rent growth for 24–36 months. It’s discipline that keeps IRR alive.

For now, pipelines suggest Q4 follow-through, aided by year-end sellers and buyers signaling “ready to close.” A Fed cut would reinforce the tone; a hawkish surprise would test it. Either way, the center of gravity has shifted from fear to underwriting. Watch three tells: (1) breadth of lenders quoting stabilized cash flows; (2) cross-border bids re-engaging dollar-hedged strategies; (3) sector divergence—industrial and necessity retail firming, multifamily clearing slower, office volumes rising from a low base with continued special-situation flow. Ultimately, volumes can compound only if today’s discipline persists
Stability isn’t relief—it’s discipline priced in.

CRE Daily — Investment volume jumped 16%/Seeking Alpha (summarizing MSCI Real Assets) — U.S. CRE Deal Volume Up 17%/Reuters — Fed still poised to cut rates/YCharts — 10-Year Treasury Rate (real-time & historical)

Never miss a Signal
Get the daily brief that busy CRE professionals rely on.