


📢Good morning,
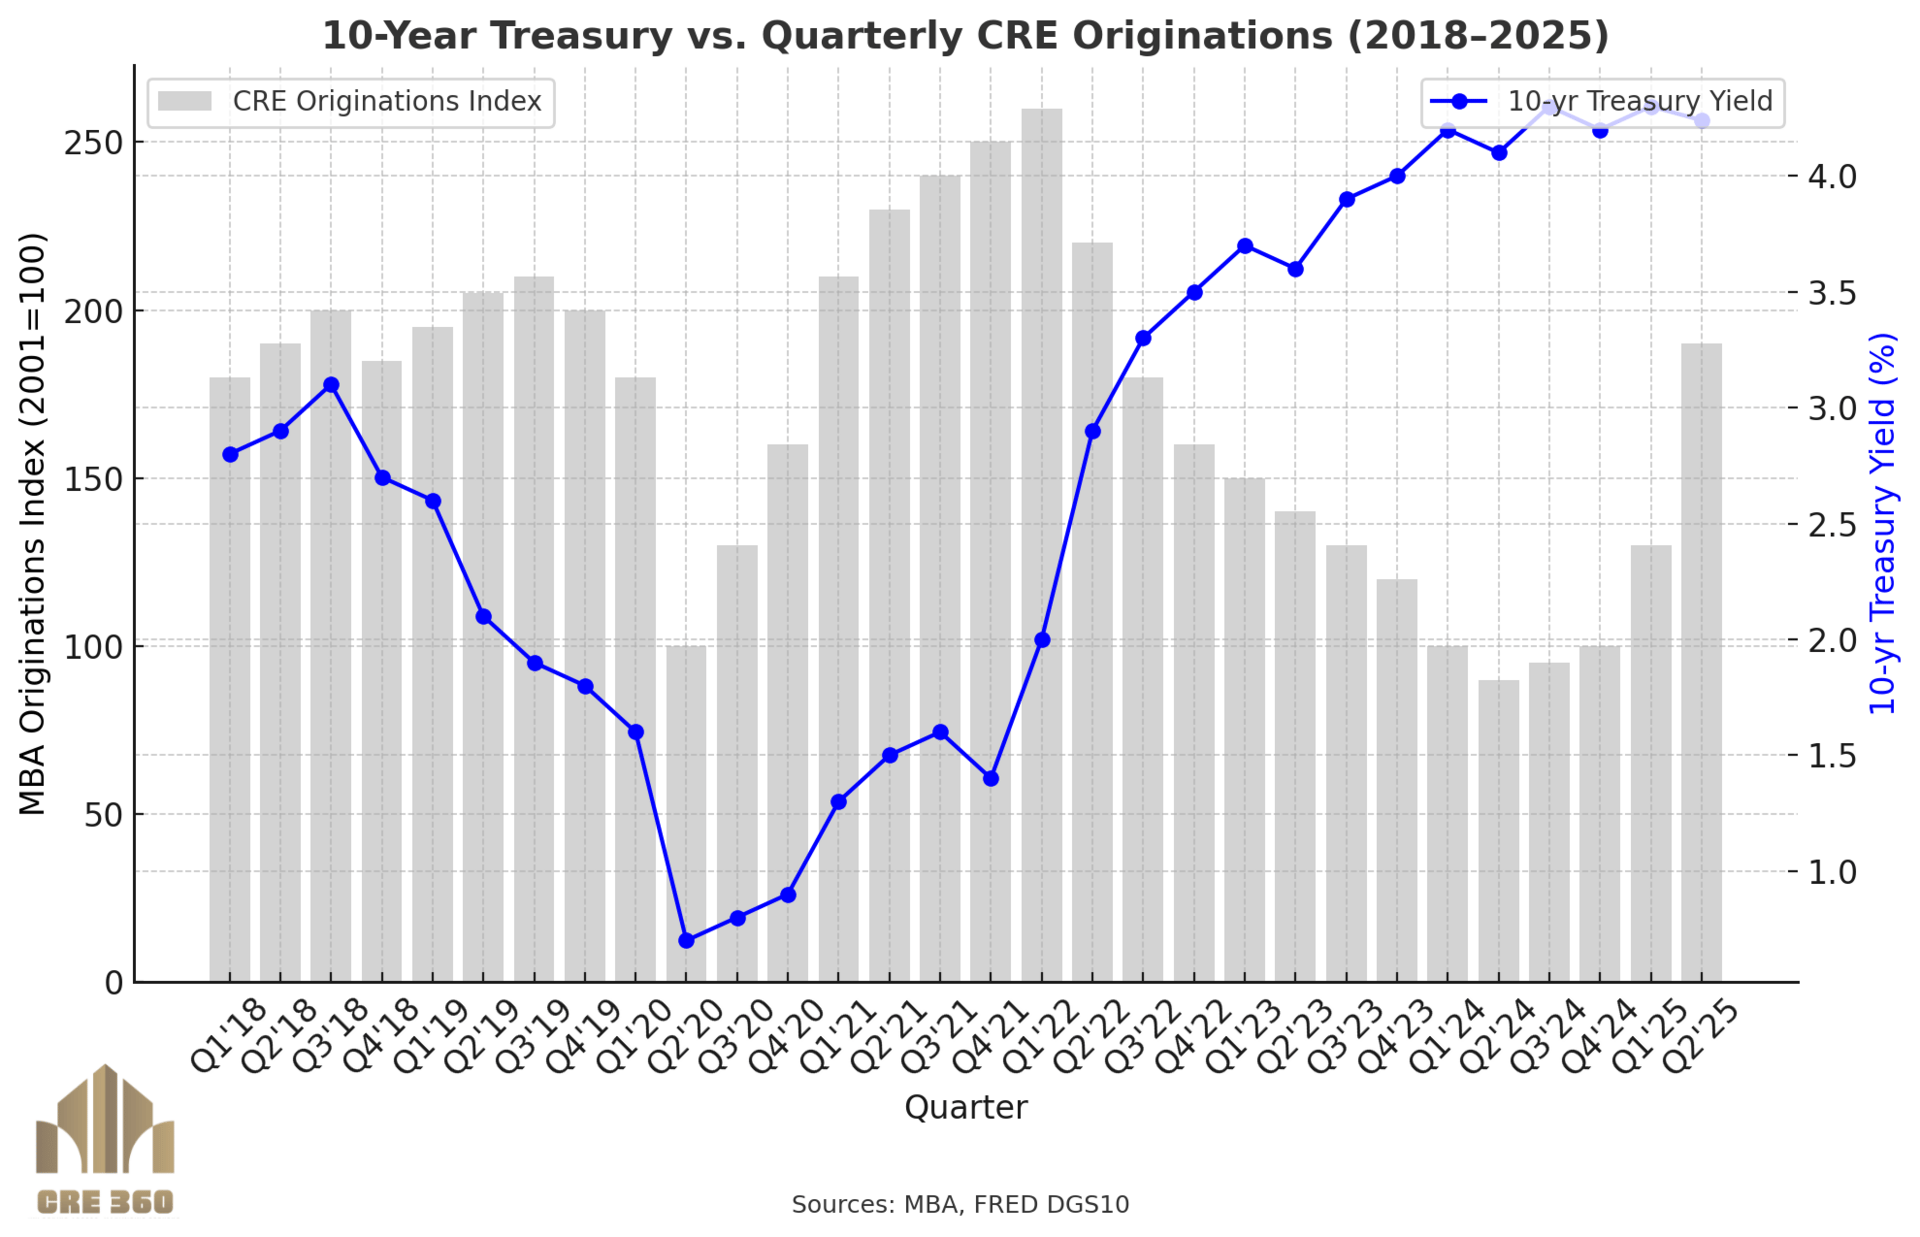
CRE debt markets reopened in Q2: new originations rose 66% YoY and 48% QoQ, with banks more than doubling activity and debt funds close behind. Lending breadth and stabilizing rates are pulling buyers back in after 2024’s freeze. The 10-year UST ~4.2% and futures markets pricing a ~90% September Fed cut have improved underwriting confidence even as spreads remain wider than pre-2022.
Forward pipelines are building, aided by price discovery and signs that values have stabilized off the 2022 peak.

+66% YoY originations (Q2 2025); +48% vs. Q1. Broad rebound across lender types.
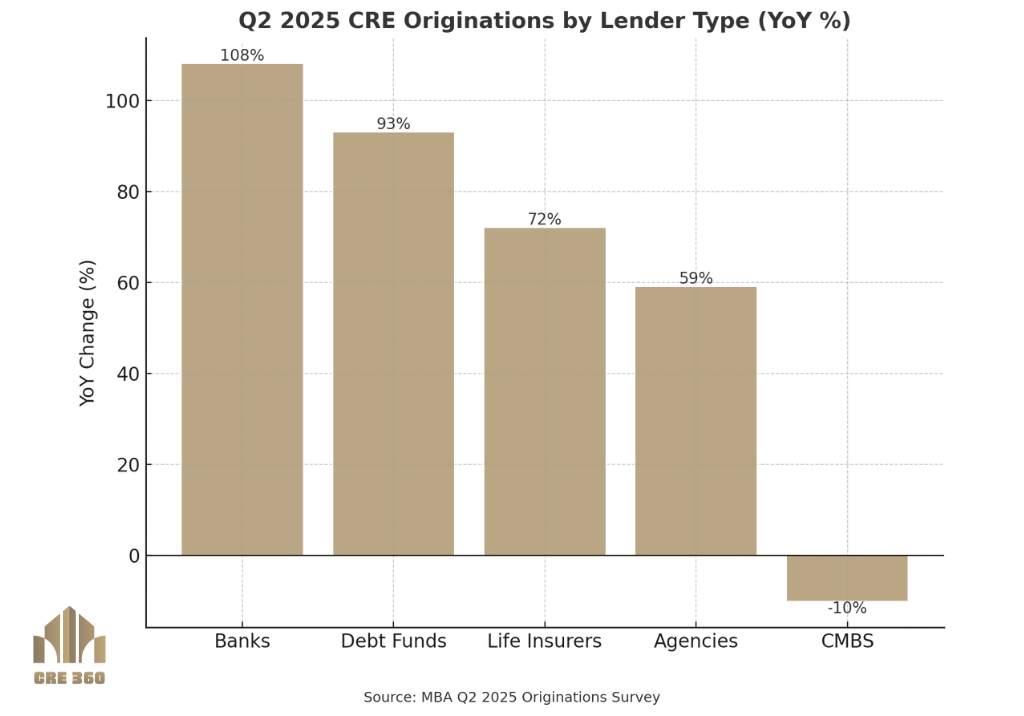
Lenders: Banks +108%, investor-driven debt funds +93%, life insurers +72%, agencies +59% YoY; CMBS –10%.
By property: Office +140%, industrial +53%, retail +30%, healthcare +77% YoY; multifamily –35%, hotel –30%.
Rates backdrop: 10-year UST ~4.24%; average permanent loan spreads ~190 bps in Q2. Implies coupons near 6–6.5% for core assets.
Maturities: ~$957B of CRE loans face 2025 maturities, keeping refi demand elevated.
Metric | Latest | |
|---|---|---|





Q2 originations YoY · +66% · MBA · Bank originations YoY · +108% · 10-yr UST (Aug 27) · 4.24% · FRED · Loan spreads (Q2 avg) · ~193 bps · CBRE · 2025 maturities · ~$957B · Multi-Housing News · Returns / Performance Trends Price discovery is advancing. Green Street’s all-property index shows +3.2% YoY but –17.7% vs. 2022 peak , consistent with a bottoming narrative at lower levels. That reset is restoring debt coverage and enabling new loans at more conservative bases. · Lending / Capital Conditions Re-engagement is broad: depositories re-opened books, debt funds scaled, and life companies and agencies lifted volumes. CMBS remains selective. Spreads are tighter than 2024 but still above 2019, keeping all-in rates elevated yet financeable. With the 10-year near 4.2% and high odds of a September Fed cut , lenders are underwriting with more rate certainty while still stressing scenarios. · Transaction Activity & Investor Flows Refi and payoff inquiries are rising ahead of maturities. The ~$957B 2025 wall ensures steady loan demand; quality assets will clear first, while transitional deals lean on debt funds or structured stacks. · Broader Implications Market stress is contained but not gone. Overall CMBS delinquency hovered a little above 7% this summer, signaling pain in older pools even as new credit flows to better collateral—supporting a cautious but improving liquidity regime. · 66% YoY jump in Q2 originations → liquidity is back, especially from banks and debt funds. · Rates stabilize : 10-yr ~4.2% and cuts priced → underwriting clarity improves. · Sector split : Office +140% origination growth from a low base; multifamily –35% as agencies stayed selective. · Values reset : Green Street –17.7% from peak , +3.2% YoY → better loan metrics on recalibrated bases. · Maturity pressure : ~$957B 2025 maturities → refi wave sustains capital flows into 2026. · Institutional Lens: Expect modest spread compression if the Fed cuts, but count on conservative proceeds. Banks and lifecos favor stabilized, cash-flowing assets at 55–65% LTV , while debt funds fill gaps for transitional stories at higher coupons. Use today’s pricing to term out risk and protect downside; CMBS remains selective and skewed to higher-quality collateral. · Operator’s Lens: Underwrite with debt yields ≥10% and DSCR ~1.30–1.40x at actual coupons. For quality assets, all-in rates ~6–7% pencil if in-place NOI is durable and exit caps are underwritten 100 bps above 2021 levels. Re-engage lenders now; pull term sheets to benchmark leverage and rate options. · If the Fed cuts, expect marginally lower coupons and slightly higher proceeds in 2026. · Refi volumes stay high through 2026 as 2024–2025 maturities roll. Bifurcation persists: prime assets clear first; transitional deals rely on structured capital. · Watch CMBS delinquency trend and spreads for early signals of broader credit easing. · 📊 Resources · Mortgage Bankers Association — Q2 2025 Originations Survey (release + PDF). MBA +1. CBRE — Q2 2025 lending spreads and capital markets figures. CBRE +1. FRED — 10-Year Treasury (DGS10). FRED. Reuters — Fed cut probabilities; Bessent housing measures and rents commentary. Reuters +1. Green Street — CPPI (All-Property): +3.2% YoY, –17.7% from 2022 peak. Multi-Housing News — 2025 CRE maturities ~$957B. Multi-Housing New. Trepp — CMBS delinquency ~7.1% (June/July 2025). Trepp +1
Never miss a Signal
Get the daily brief that busy CRE professionals rely on.