


📢 Good morning,
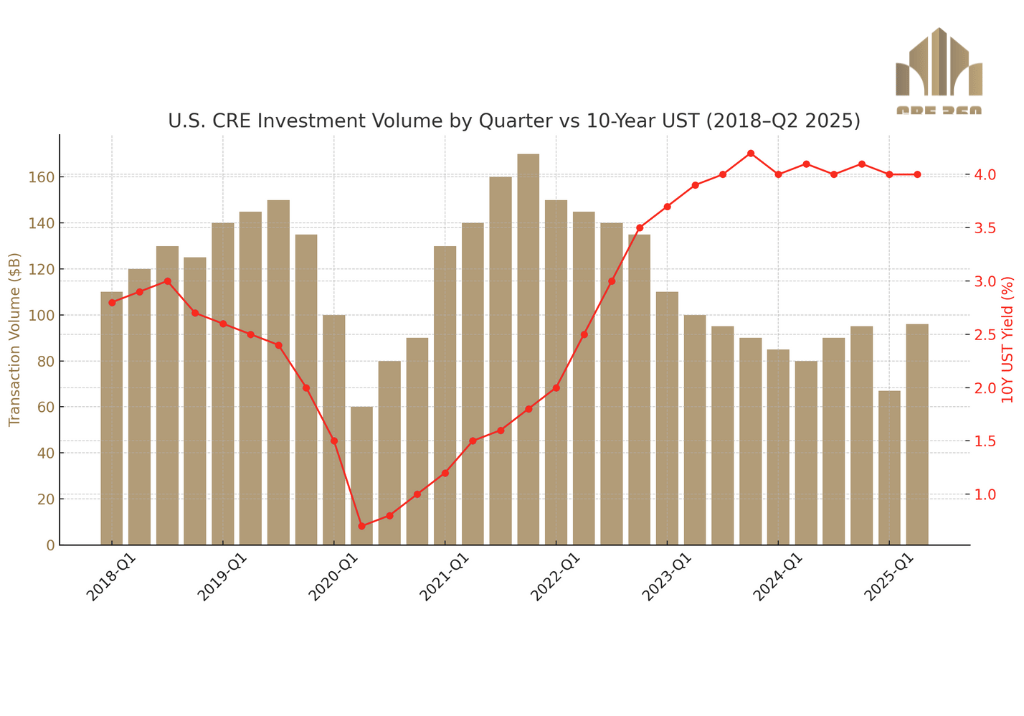
Investment sales are thawing: U.S. CRE transactions ≥$5M rose 16% year-over-year to $163.6B in H1 2025.
Momentum carried into Q2: investment volume reached $96B excluding entity deals (+13% YoY), led by private buyers, while inbound cross-border remained small. Pricing has stabilized in aggregate with retail and industrial modestly up and office still drifting down, pointing to a selective, quality-led recovery.

H1 2025 total (≥$5M): $163.61B, +16% YoY; $5–25M segment +3.5% to $45.24B.
Q2 2025 investment volume (ex-entity): $96B, +13% YoY; private buyers $60B, institutions $17B; inbound cross-border $4B (–2% YoY).
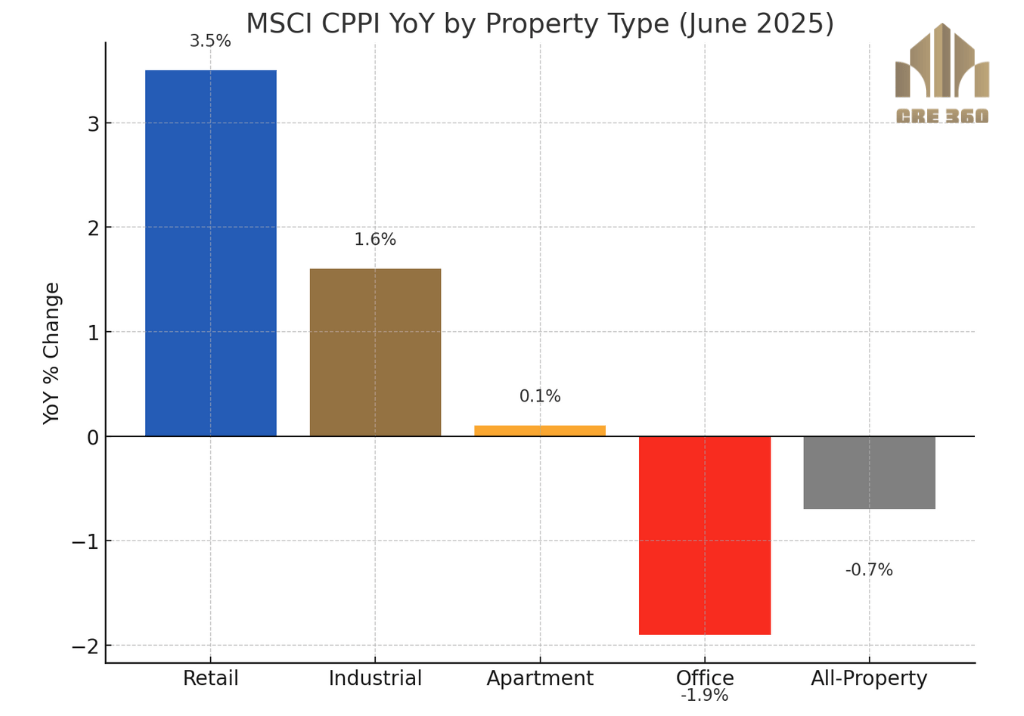
Pricing (MSCI CPPI, YoY to June): All-Property –0.7%; Retail +3.5%; Industrial +1.6%; Apartment +0.1%; Office –1.9%. Major Metros –5.4% vs Non-Majors +1.1%.
Deal scale re-emerges: NYC’s 590 Madison closed ~$1.0–$1.1B; Blackstone took a 46–49% stake in 1345 Ave. of the Americas at a $1.4B valuation with ~$800–850M financing.
Altus cross-check (Q2 all-in): $115B transacted (+3.8% YoY); median $/SF +13.9% YoY; asset count –7.4% YoY.
Table: CPPI YoY Change (June 2025)
Sector | YoY % | Note |
|---|---|---|
All-Property | –0.7 | Stabilizing |
Retail | +3.5 | Income growth tailwind |
Industrial | +1.6 | Growth moderating |
Apartment | +0.1 | First YoY uptick since 2022 |
Office | –1.9 | CBD –4.2; Suburban –2.1 |

Returns / Performance Trends
Transaction velocity is improving while prices are near a floor outside of office. Retail and industrial show modest YoY price gains; apartments have turned slightly positive; offices continue to re-price, especially in gateway CBDs. The major-metro underperformance versus non-majors shows investors still favoring cheaper, faster-growing markets for risk-adjusted return.
Lending / Capital Conditions
Greater debt availability is supporting bid-ask convergence: Q2 buyer mix skewed to private and institutional capital, consistent with broader lending momentum and improved underwriting clarity. Cross-border remains thin, limiting incremental demand but reducing competition for domestic capital.
Transaction Activity & Investor Flows
H1 volumes confirm a rebound from 2024’s trough, with brokered trades gaining share. Large, high-profile New York trades signal renewed risk appetite for prime assets, even as secondary offices remain challenged. Portfolio and single-asset execution both work when income durability is strong.
Broader Implications
The market is K-shaped: high-quality and non-major-metro assets clear first; legacy CBD office value discovery persists. With pricing stabilization and selective cap-rate compression likely where NOI visibility is best, expect disciplined underwriting to sustain, not an indiscriminate chase.

H1 sales +16% to $163.6B ⇒ liquidity returning; brokered share rising.
Q2 volume +13% to $96B ⇒ private buyers lead; cross-border $4B remains muted.
Prices: All-Property –0.7% YoY with Retail +3.5% / Industrial +1.6% / Office –1.9% ⇒ selective stabilization.
Mega-deals back: 590 Madison ~$1B+; 1345 Sixth Ave $1.4B JV ⇒ trophy risk appetite is active.
Major metros lag (CPPI –5.4%) vs non-majors +1.1% ⇒ relative value outside gateways.
Institutional Lens: Focus deployment where price discovery is complete and income durability is high. Lean into retail centers with demonstrable sales growth and modern industrial with sticky tenants; underwrite apartments to flat-to-modest rent growth and lower exit cap compression. Office exposure should be limited to best-in-market, long-lease assets where re-tenanting risk is minimal and basis reflects CPPI declines.
Operator’s Lens: If you sell, package stabilized, clean stories; if you buy, target mispriced non-majors or prime assets with fixable items. Use recent mega-deals as comp guardrails, not justifications to stretch. Keep financing flexible; cross-border is thin, so domestic debt/equity relationships are the lever.

Watch Q3/Q4 volumes for confirmation of a broad-based recovery; CBRE signals continued improvement. Expect cap-rate stability to slight compression in retail/industrial; office remains two-speed.
Private buyers should remain dominant; a cross-border uptick would be additive but is not a base case.
If rates ease, bid-ask could close further; watch pricing in major vs non-major metros for convergence

Green Street / Real Estate Alert — Mid-Year Broker Rankings, H1 2025 sales up 16% (≥$5M) and $5–25M +3.5%. . CBRE — Q2 2025 U.S. Capital Markets Figures (volume +13% YoY to $96B; buyer mix; cross-border). MSCI Real Assets — RCA CPPI (July 24, 2025) pricing by sector; major vs non-major metros. Altus Group — Q2 2025 U.S. Investment & Transactions (all-in $115B, PPSF +13.9%). The Real Deal / Reuters — 590 Madison ~$1B+ closed; 1345 Sixth Ave stake and financing.

Never miss a Signal
Get the daily brief that busy CRE professionals rely on.