

📢 Good morning,
MetLife’s $165.5M sale of a three-property SoCal portfolio showed investor appetite for warehouses remains strong. Regional vacancy climbed to 4.8% in Q2, up from <1% in 2021, but still among the lowest in the U.S. Leasing velocity hit 16.2M SF in H1, a four-year high, signaling demand is still robust. Rents have plateaued at record levels (~$1.45/SF/mo) as new supply delivers, easing the shortage without eroding confidence.

Vacancy: LA County 4.8% (Q2 2025), up from 0.9% in 2022; IE ~5.5%, OC ~3.2%.
Leasing: 16.2M SF leased YTD through June, strongest first-half since 2021.
Rents: $1.45/SF/mo NNN avg (flat YoY), +80% vs. 2019.
Cap rates: Class A ~4.75–5.0% vs. 3.8% in 2021; portfolio implied ~mid-4%.
Pipeline: ~40M SF under construction, down from 50M+ in 2022; starts off 25%+ YoY.
Metric | Q2 2025 | Peak/Prior |
|---|---|---|
LA vacancy | 4.8% | 0.9% (2022) |
IE vacancy | 5.5% | ~2% (2021) |
Leasing (H1) | 16.2M SF | 2021 record |
Asking rent | $1.45/SF/mo | $0.95 (2019) |
Cap rates | 4.75–5.0% | 3.8% (2021) |

Returns / Performance Trends
Industrial delivered outsized returns from 2020–22; today’s normalization means lower appreciation but steady income. Values have corrected ~10–15% from peak, consistent with Green Street’s industrial index. Investors still bid low-4s cap for infill trades, reflecting conviction in long-run rent growth.
Lending / Capital Conditions
Industrial is still the most financeable sector. Banks, insurers, and CMBS will underwrite 60–65% LTV with spreads tighter than office or retail. Debt funds fill gaps for lease-up deals. Conservative pro formas (flat rents, slower lease-ups) are the norm, but liquidity remains.
Transaction Activity & Investor Flows
Large-core buyers like TA Realty and Terreno participated in MetLife’s sale, underscoring institutional conviction. REITs remain acquisitive; Prologis and peers retain balance-sheet capacity to buy stabilized portfolios. Expect continued recycling of mature assets as sellers capture near-peak pricing.
Broader Implications
Vacancy at ~5% signals market health, not weakness. Tenants finally have options, but no sign of distress. Scarce land and high replacement costs cap downside. ESG retrofits (solar, cool roofs) and tenant-friendly leasing are differentiators in a slightly more competitive environment.

Vacancy up to 4.8% (from 0.9% in 2022) → supply caught up, market balanced.
16.2M SF leased in H1 → demand resilient, highest in 4 years.
Rents flat at $1.45/SF/mo → plateau after +80% growth since 2019.
Cap rates widened to ~5% → values down ~10–15% from 2022 peak.
40M SF under construction → deliveries tapering, reducing future risk.
Institutional Lens: Underwrite at 0–1% rent growth near term; expect flat NOI in 2025 before acceleration if vacancy stabilizes. Financing is abundant; fixed debt in mid-5s possible for core assets. Focus capital on infill, port-proximate assets where scarcity supports long-term rent upside.
Operator’s Lens: Renew tenants early; offer modest concessions to lock occupancy. For new builds, pre-lease aggressively—competition is higher. Seek opportunistic buys: half-leased or rollover-heavy assets can be acquired near 5.5% caps and stabilized to ~4.5%.

Vacancy likely to drift into 5–6% range by 2026 as final pipeline delivers.
Rent growth muted (<1% 2025) before re-accelerating if supply slows.
Expect portfolio trades; institutional appetite remains elevated.
Redevelopment trend: obsolete retail/office to logistics.
Risks: California regulation on emissions, trucking, taxes could lift operating costs.

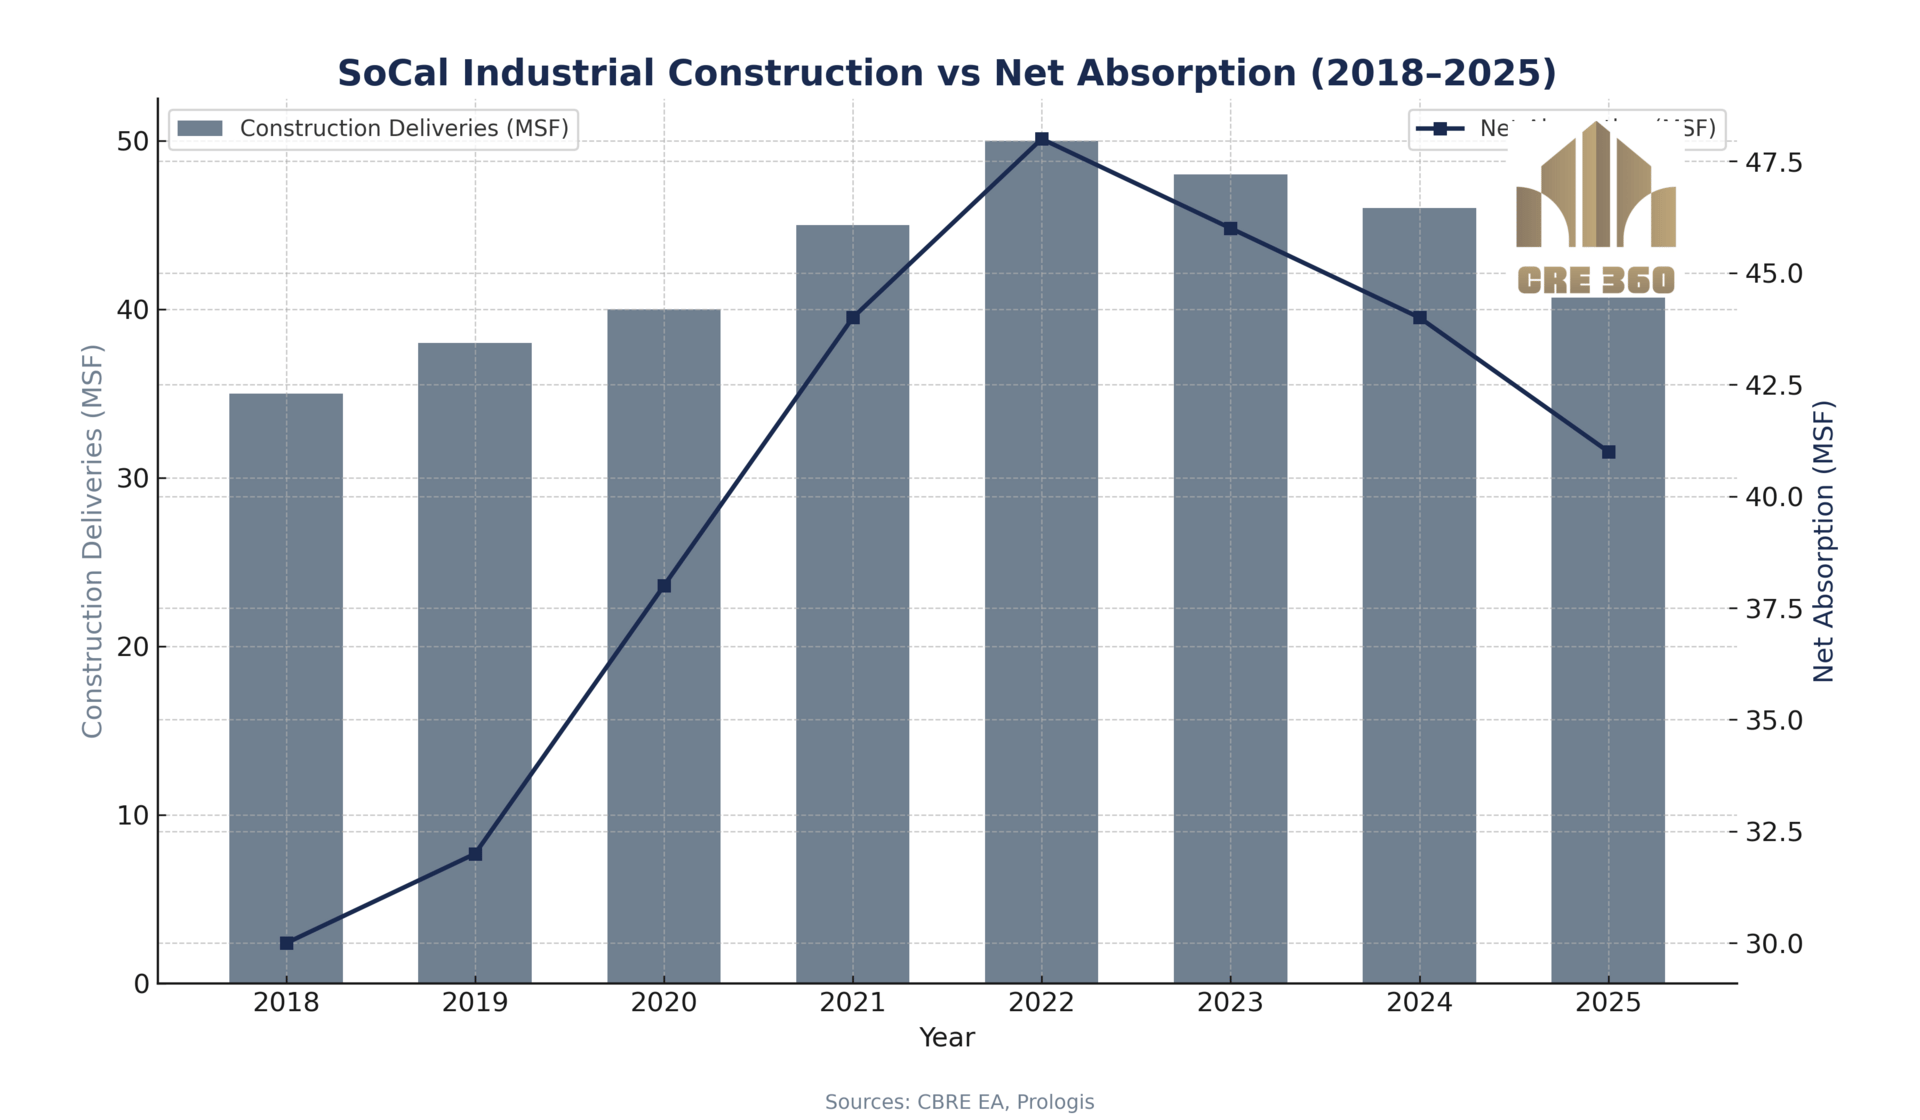
Chart 2 – SoCal Industrial Construction vs Net Absorption (2018–2025)
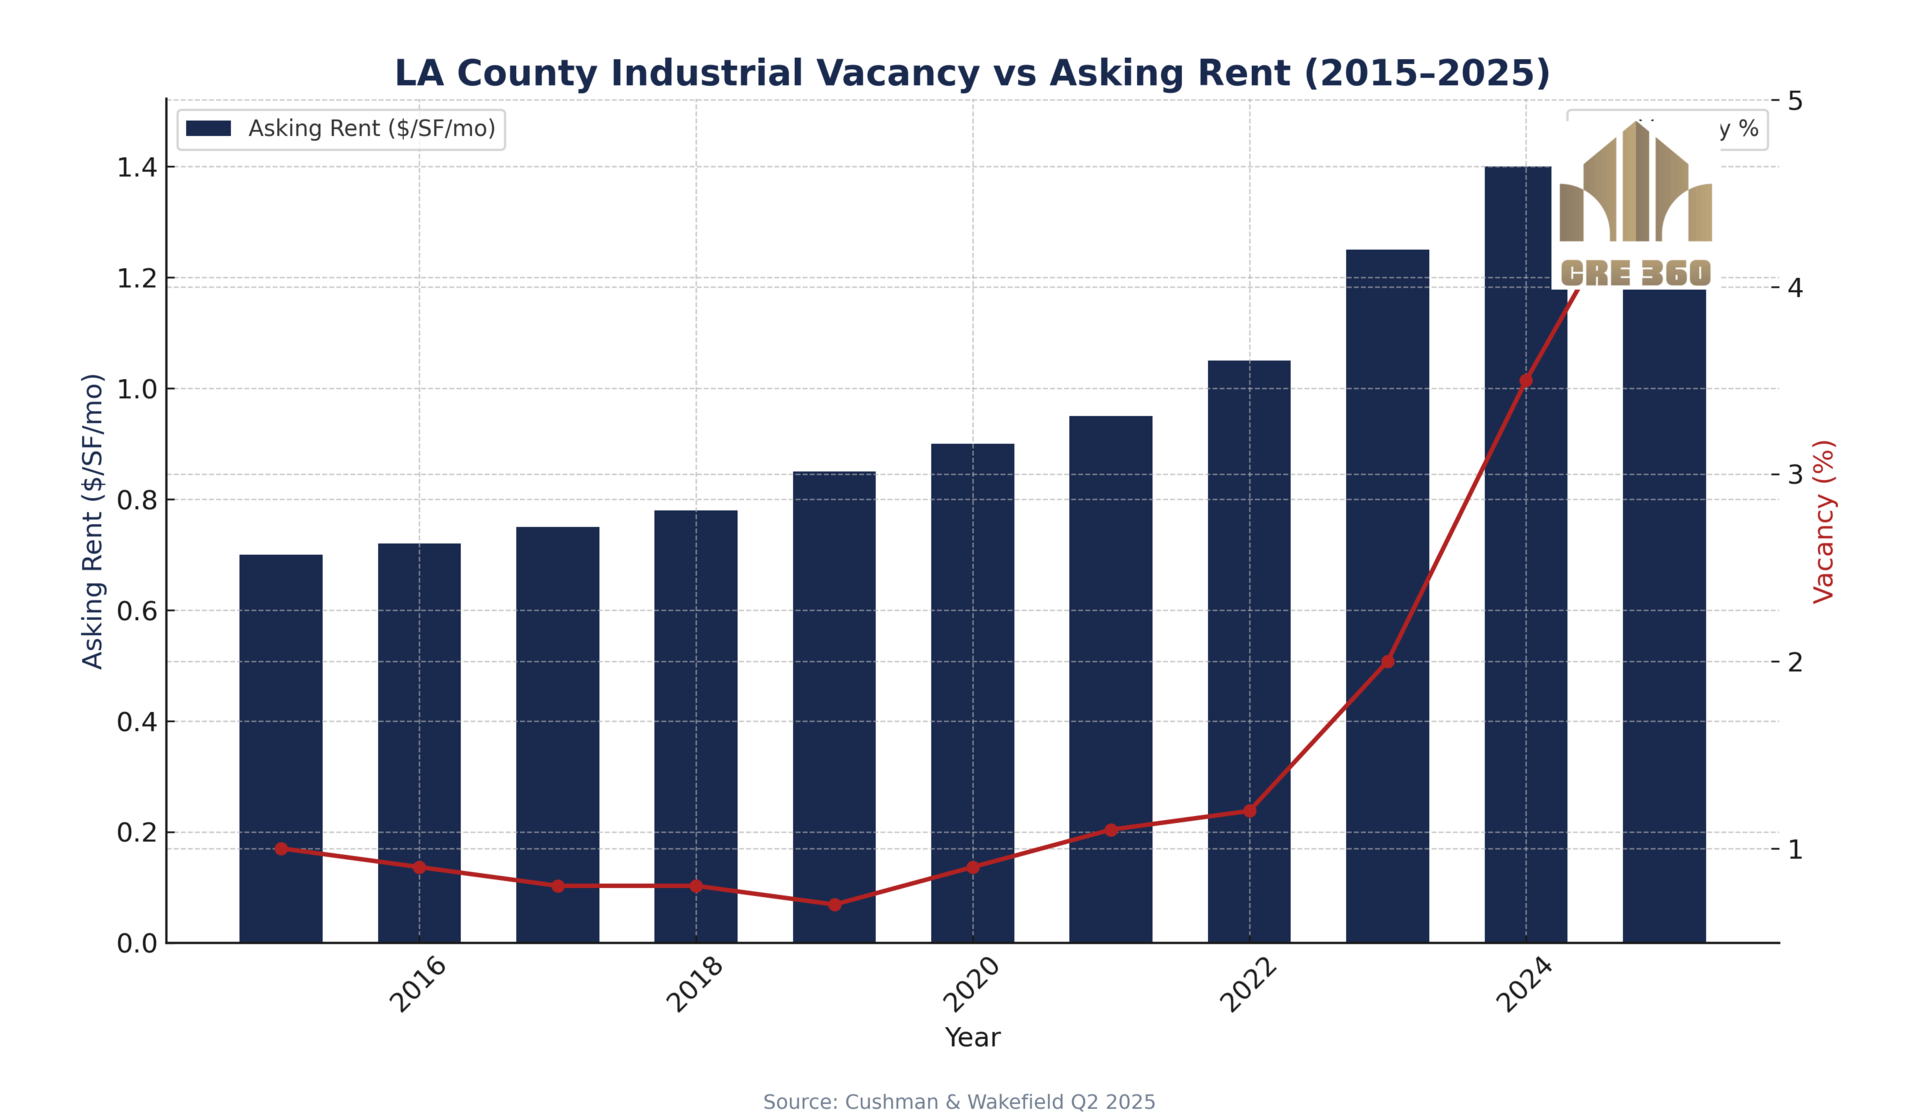
Chart 1 – LA County Industrial Vacancy vs Rent (2015–2025)

Never miss a Signal
Get the daily brief that busy CRE professionals rely on.