


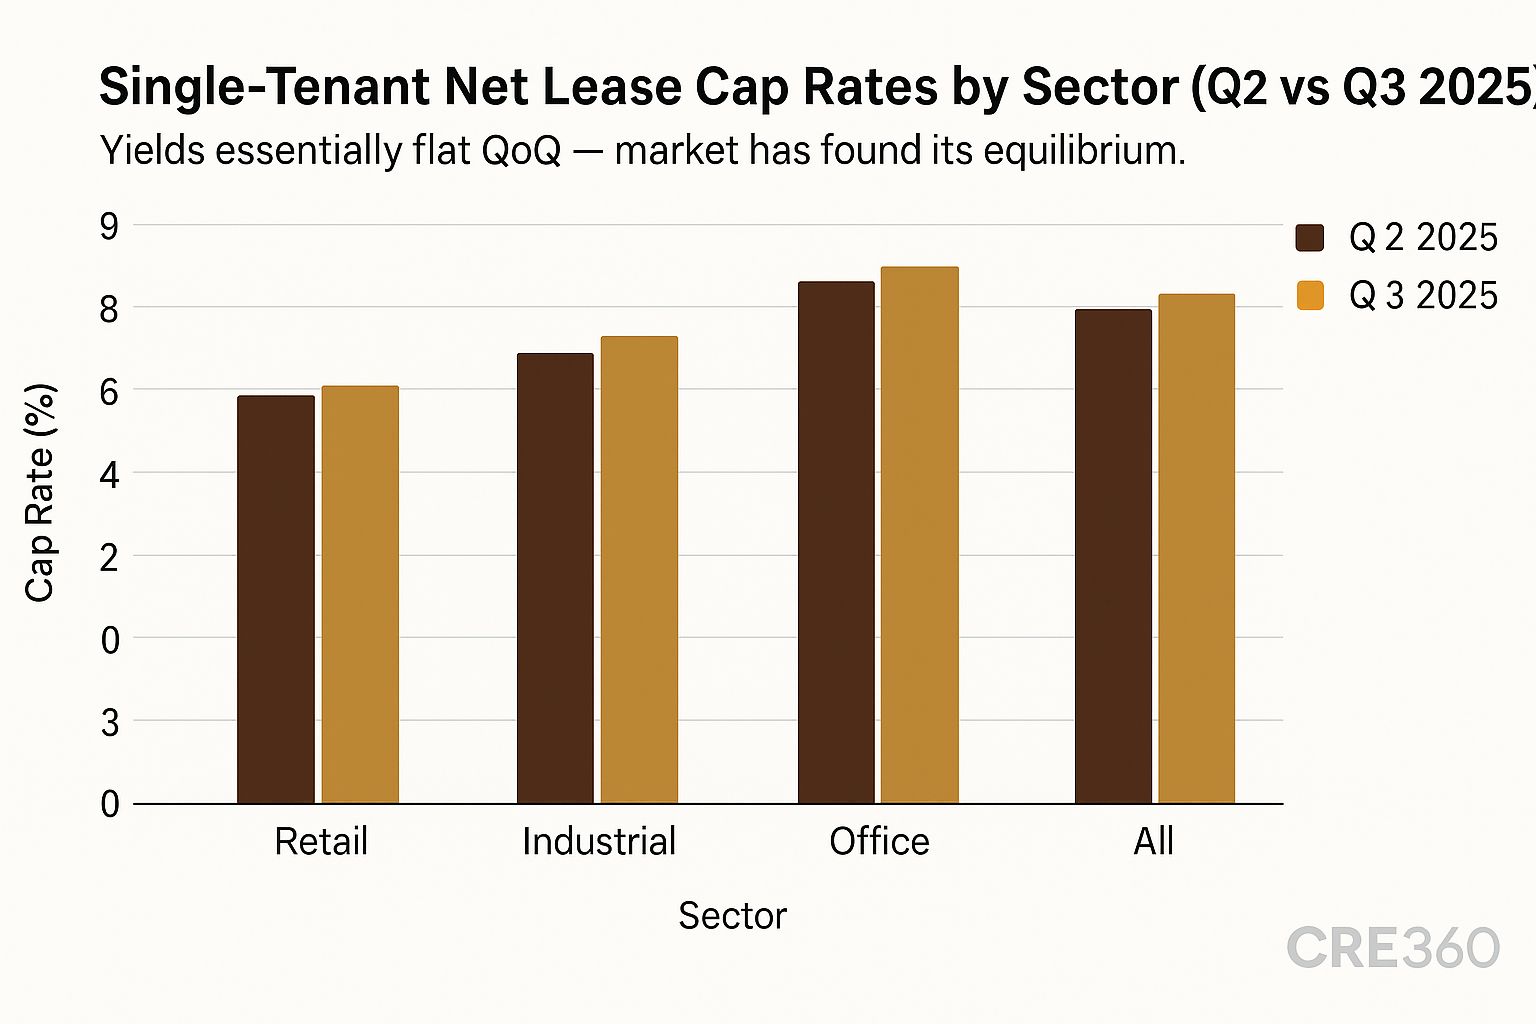
🚨After two years of rate-driven yield expansion, the single-tenant net lease (STNL) market found equilibrium in Q3 2025. Average cap rates rose just 1 basis point to 6.80%, effectively flat from Q2. Retail remained steady at 6.57%, industrial compressed to 7.20% (–3 bps), and office softened to 7.90% (+5 bps). Bid-ask spreads tightened to ~30 bps, signaling renewed price consensus between buyers and sellers and a stable financing backdrop for long-term, income-focused investors.

Overall Net Lease Cap Rate: 6.80%, +1 bp QoQ — [Source: The Boulder Group].
Retail STNL Cap Rate: 6.57% (QoQ flat) — [Source: The Boulder Group].
Industrial STNL Cap Rate: 7.20% (–3 bps QoQ) — [Source: The Boulder Group].
Office STNL Cap Rate: 7.90% (+5 bps QoQ) — [Source: The Boulder Group].

Loan Performance. Stable yields support DSCR levels near 1.3× for new loans; high-credit tenants still qualify for partial IO terms. Minimal further widening expected unless rates rise anew.
Demand Dynamics. QSR and convenience retail assets lead demand; office remains segmented. Investors are rewarding 15-year leases and A-credit tenants with 200 bps pricing advantage.
Asset Strategies. Owners can trade up from 7–8% short-lease assets to 6% long-term credit deals via 1031 exchanges; reposition low-credit tenants before year-end.
Capital Markets. Debt spreads narrowed as volatility eased; lenders offer 65–70% LTV for strong credits. Net-lease CLO issuance steady as bid-ask spreads compress.

Cap rates plateau ≈ 6.8%, implying pricing stability.
QSR and essential retail remain favored.
Lenders prefer investment-grade tenants; moderate leverage.
Spreads tight → healthy liquidity and steady deal flow.
🛠 Operator’s Lens
Refi. Stable cap rates enable rate locks around 6–7%; IO available for top credits.
Value-Add. Upgrade tenant credit or extend lease to compress exit cap 150 bps.
Development. Build-to-suit pipeline active; developers pre-selling at 4.4–5.0% caps.
Lender POV. Banks tiering pricing by tenant risk; office underwriting remains defensive.

Fed policy easing could trigger 25–50 bps cap rate compression for A-credit deals by mid-2026. Watch tenant credit events (Walgreens, casual dining) for spread re-pricing. Transaction volume likely to rise as stability builds confidence in asset valuations.

The Boulder Group — Net Lease Market Report (Q3 2025). https://www.bouldergroup.com/research CRE Daily — Net Lease Cap Rate Stability (Oct 2025). https://credaily.com GlobeSt — Net Lease Investor Trends (Oct 2025). https://www.globest.com

Never miss a Signal
Get the daily brief that busy CRE professionals rely on.