➤ Key Highlights
National office supply remained modest entering November, with just over 33 million square feet under construction.
Boston, Manhattan, and Dallas were the most active pipelines last month, each surpassing 2 million square feet of new office space under construction.
Los Angeles followed with nearly 2 million square feet, and San Diego reported roughly 1.4 million square feet under construction.
National office vacancy declined slightly year-over-year to 18.6% in October.
The national average listing rate remained stable at $32.81 per square foot.
San Francisco remained the priciest Western market with asking rents exceeding $65 per square foot.
Year-to-date office sales through October totaled nearly $43 billion, with transactions averaging $191 per square foot.
Office construction activity remained modest entering November, with a total of just over 33 million square feet underway nationally. Vacancy rates declined slightly, and average listing rates stayed stable, while several major markets maintained active construction pipelines. Office sales volume remained significant through October.
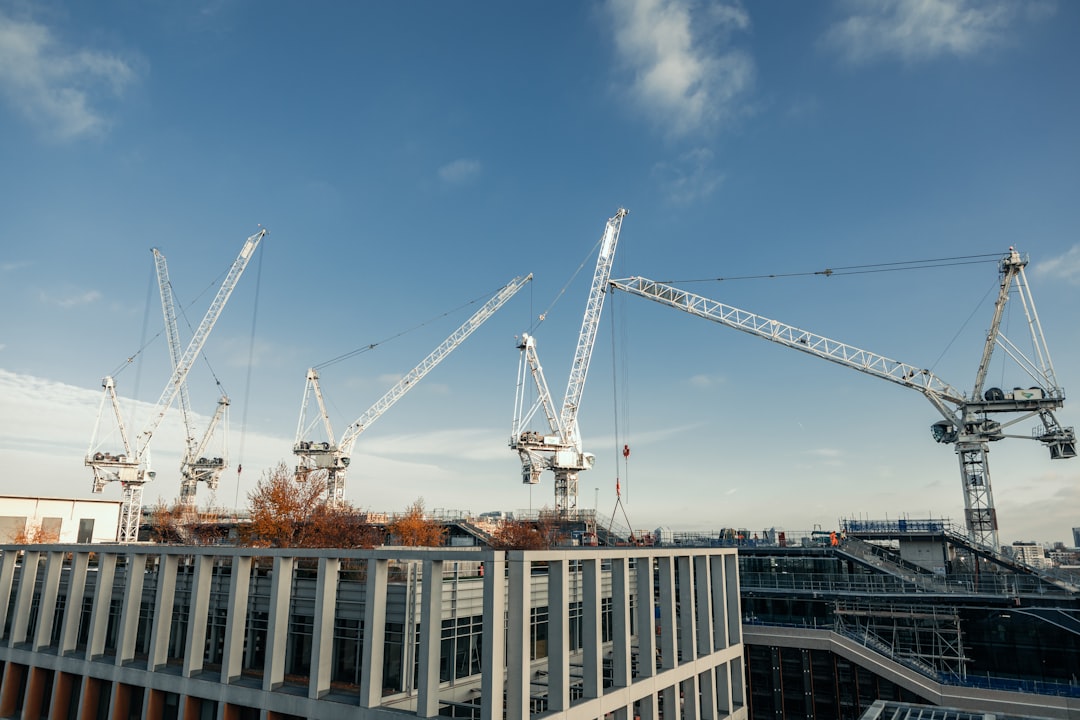
Examining the evolving supply-side dynamics reveals how cautious construction pacing is responding to shifts in office utilization. The current environment demonstrates a recalibration in space delivery as developers and stakeholders adjust to new patterns of demand. This approach allows stakeholders to better align new supply with long-term trends in how office space is allocated and used. The focus on construction timing and volume reflects broader adjustments to expectations for office environments going forward.
⚠️ Why it matters now
For CRE professionals, understanding supply-side adjustments is critical for navigating future office market cycles. Changes in the construction pipeline, shaped by utilization patterns, affect everything from leasing strategies to asset valuation and underwriting. A clear view of these dynamics helps inform decisions across development, capital allocation, and market positioning.
Stop Reading Headlines
Subscribe to CRE 360 Signal™ Newsletter to Move Smarter in Today's CRE Market.Start Understanding the Market
➤ TAKEAWAY
Continued monitoring of construction activity may reveal further adjustments as utilization patterns stabilize or evolve. Stakeholders could look for additional signals in vacancy and rental rates to inform their response to shifting supply and demand. The relationship between new deliveries and changing expectations for office use will likely remain an area of focus going forward.
❝➤ Charts & ResourcesNever miss a Signal
Get the daily brief that busy CRE professionals rely on.