

📢 Good morning,
U.S. apartment rents were flat in August (0.0% MoM), one of the weakest summer leasing seasons in years. Annual rent growth slowed to just 0.7% YoY, a steep deceleration from the double-digit gains of 2021–2022. The stall reflects record new deliveries meeting steady, but not surging, demand. Occupancy has slipped into the mid-94% range, down from ~96% a year ago, and concessions are re-emerging in oversupplied submarkets.

National rent growth: 0.0% MoM (Aug 2025)
Annual rent growth: +0.7% YoY (vs. >10% peak in 2022)
National occupancy: ~94.5%, down from ~96% YoY
Deliveries: ~400,000 units in 2025, concentrated in Class A
CMBS multifamily delinquency: ~1.9% (Trepp)
All-in agency loan rates: 6%–6.5% (vs. <4% in 2021–22)
Sun Belt rent declines: -3% or worse YoY in Austin, Phoenix, Las Vegas, Denver
Midwest/Northeast gains: +3–4% YoY in Chicago, Columbus, New Jersey
10-year Treasury: ~4.3%; implied multifamily cap rates 5.25%–6%

1. Supply Surge vs. Demand
Deliveries are peaking at ~400,000 units nationally in 2025. Demand remains positive, but absorption lags the pace of completions. Luxury Class A is most exposed, with Class B/C more stable. Concessions are back in markets like Dallas and Nashville.
2. Regional Split
Midwest and Northeast metros with limited pipelines (Chicago, Columbus, New Jersey) post 3–4% rent growth. Former boomtowns of the Sun Belt (Austin, Phoenix, Las Vegas, Denver) register rent drops of –3%+ YoY, pressured by large pipelines and slower in-migration.
3. Capital Market Adjustment
Cap rates are resetting higher to 5.25–6%, reflecting both higher Treasuries (~4.3%) and flat NOI growth. Agency lending remains active but conservative, with LTVs tighter and rent assumptions cautious. Equity IRR hurdles have widened by ~100 bps.
4. Policy Environment
Policymakers are pushing affordability via rent controls (e.g., St. Paul) and zoning reforms. While long-term supply-supportive, these measures create underwriting uncertainty. Potential rent caps in Colorado and Florida are watched closely by investors.

Equilibrium Achieved: Supply has caught up to demand, flattening rent growth.
Regional Divergence: Midwest/Northeast outperform; Sun Belt under pressure.
Capital Conservatism: Investors and lenders recalibrate assumptions, slowing deal flow.
Policy Headwinds: Regulation and affordability debates shape underwriting risk.
Retention Priority: Lease renewals over rent hikes; service quality and modest concessions drive occupancy.
Amenity on Budget: Small upgrades (package lockers, dog parks) and tech adoption offset lack of new-build flash.
Expense Discipline: 3–5% cost growth vs. 0% rent growth compresses NOI. Operators trim expenses carefully without hurting tenant satisfaction.

Rents are expected to remain flat nationally through 2025–2026, with some softness in high-supply metros. By late 2026 into 2027, as the construction pipeline shrinks (due to fewer starts since 2023), fundamentals could tighten, reviving 2–3% rent growth. Transaction volume may pick up in 2026 if interest rates ease and sellers adjust pricing expectations. Long-term, demographic and affordability pressures still underpin demand, but the near-term environment is one of margin compression and conservative underwriting.

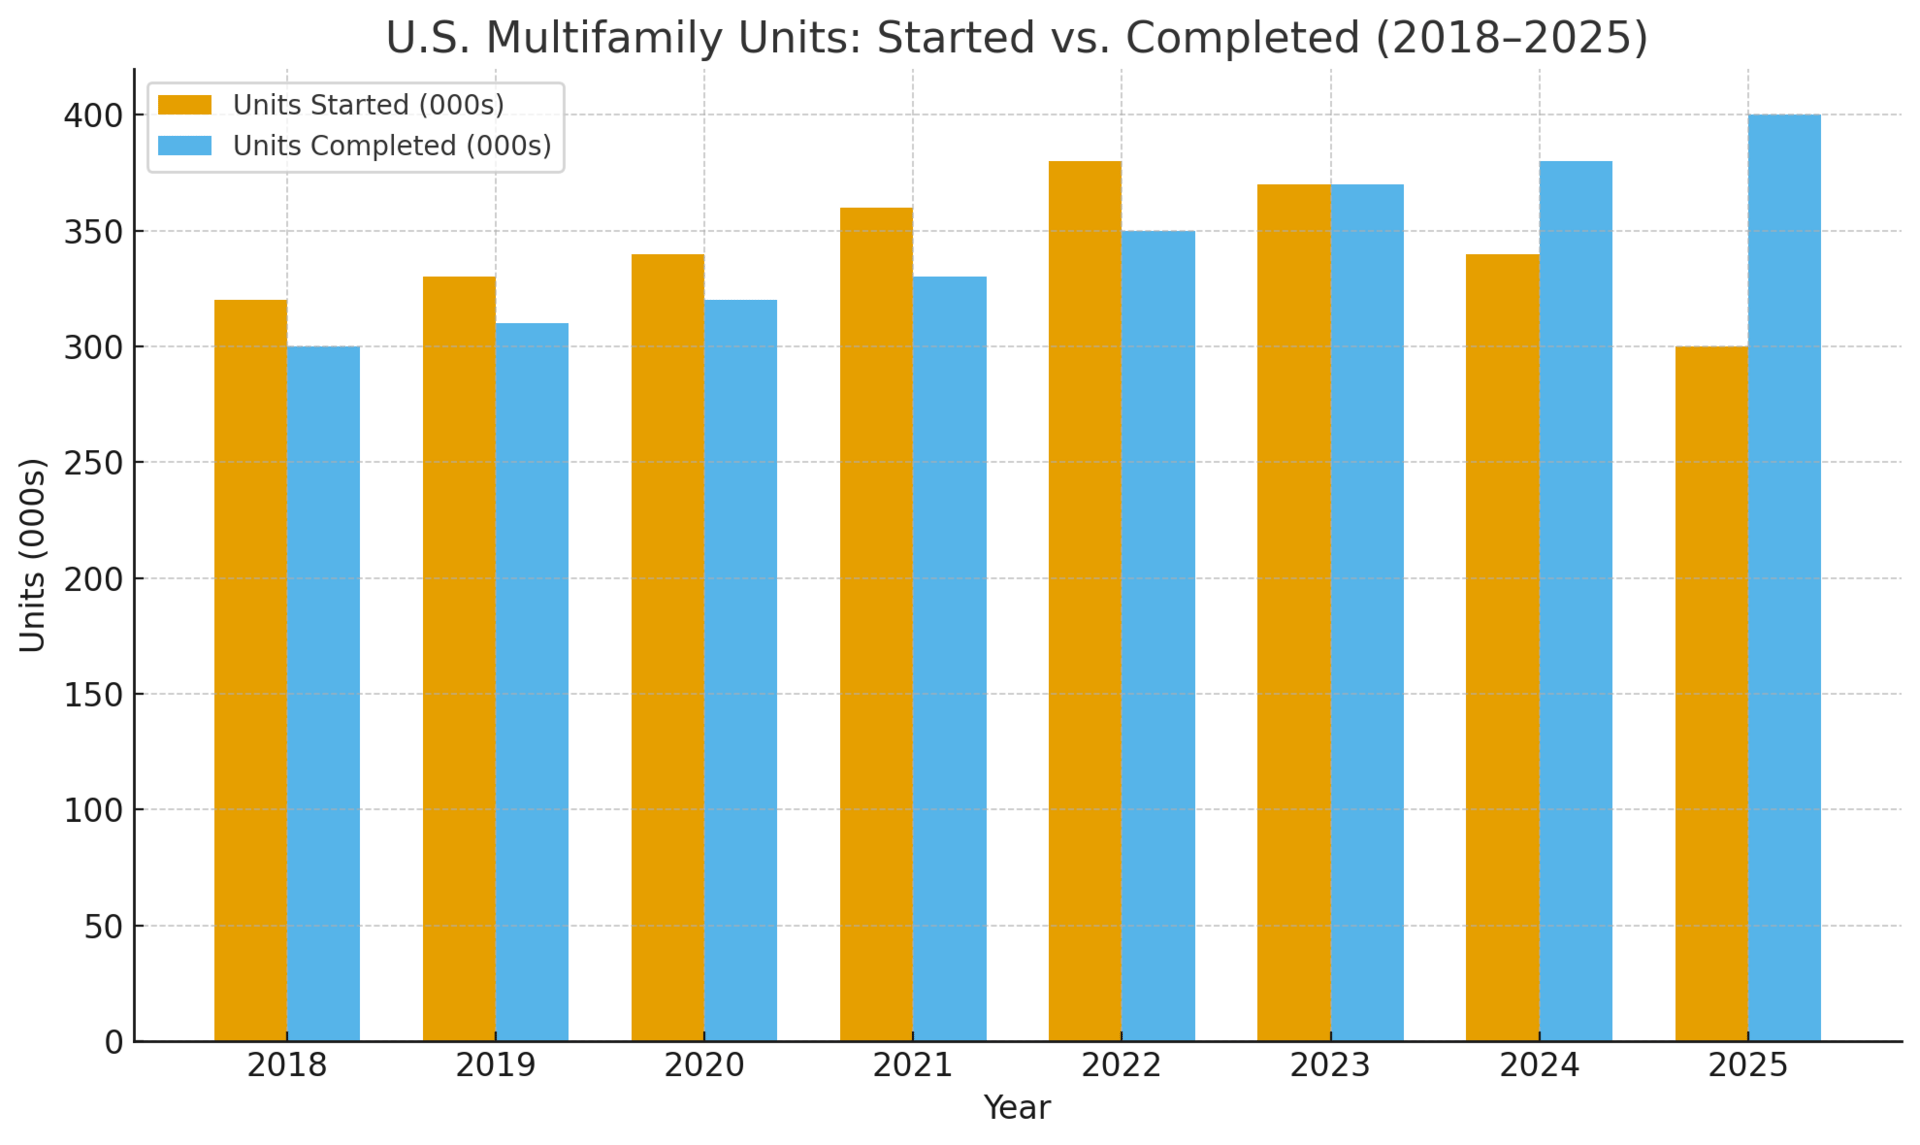
U.S. Multifamily Units Started vs. Completed, 2018–2025 — illustrates completions peaking at ~400k in 2025 while starts are already declining.
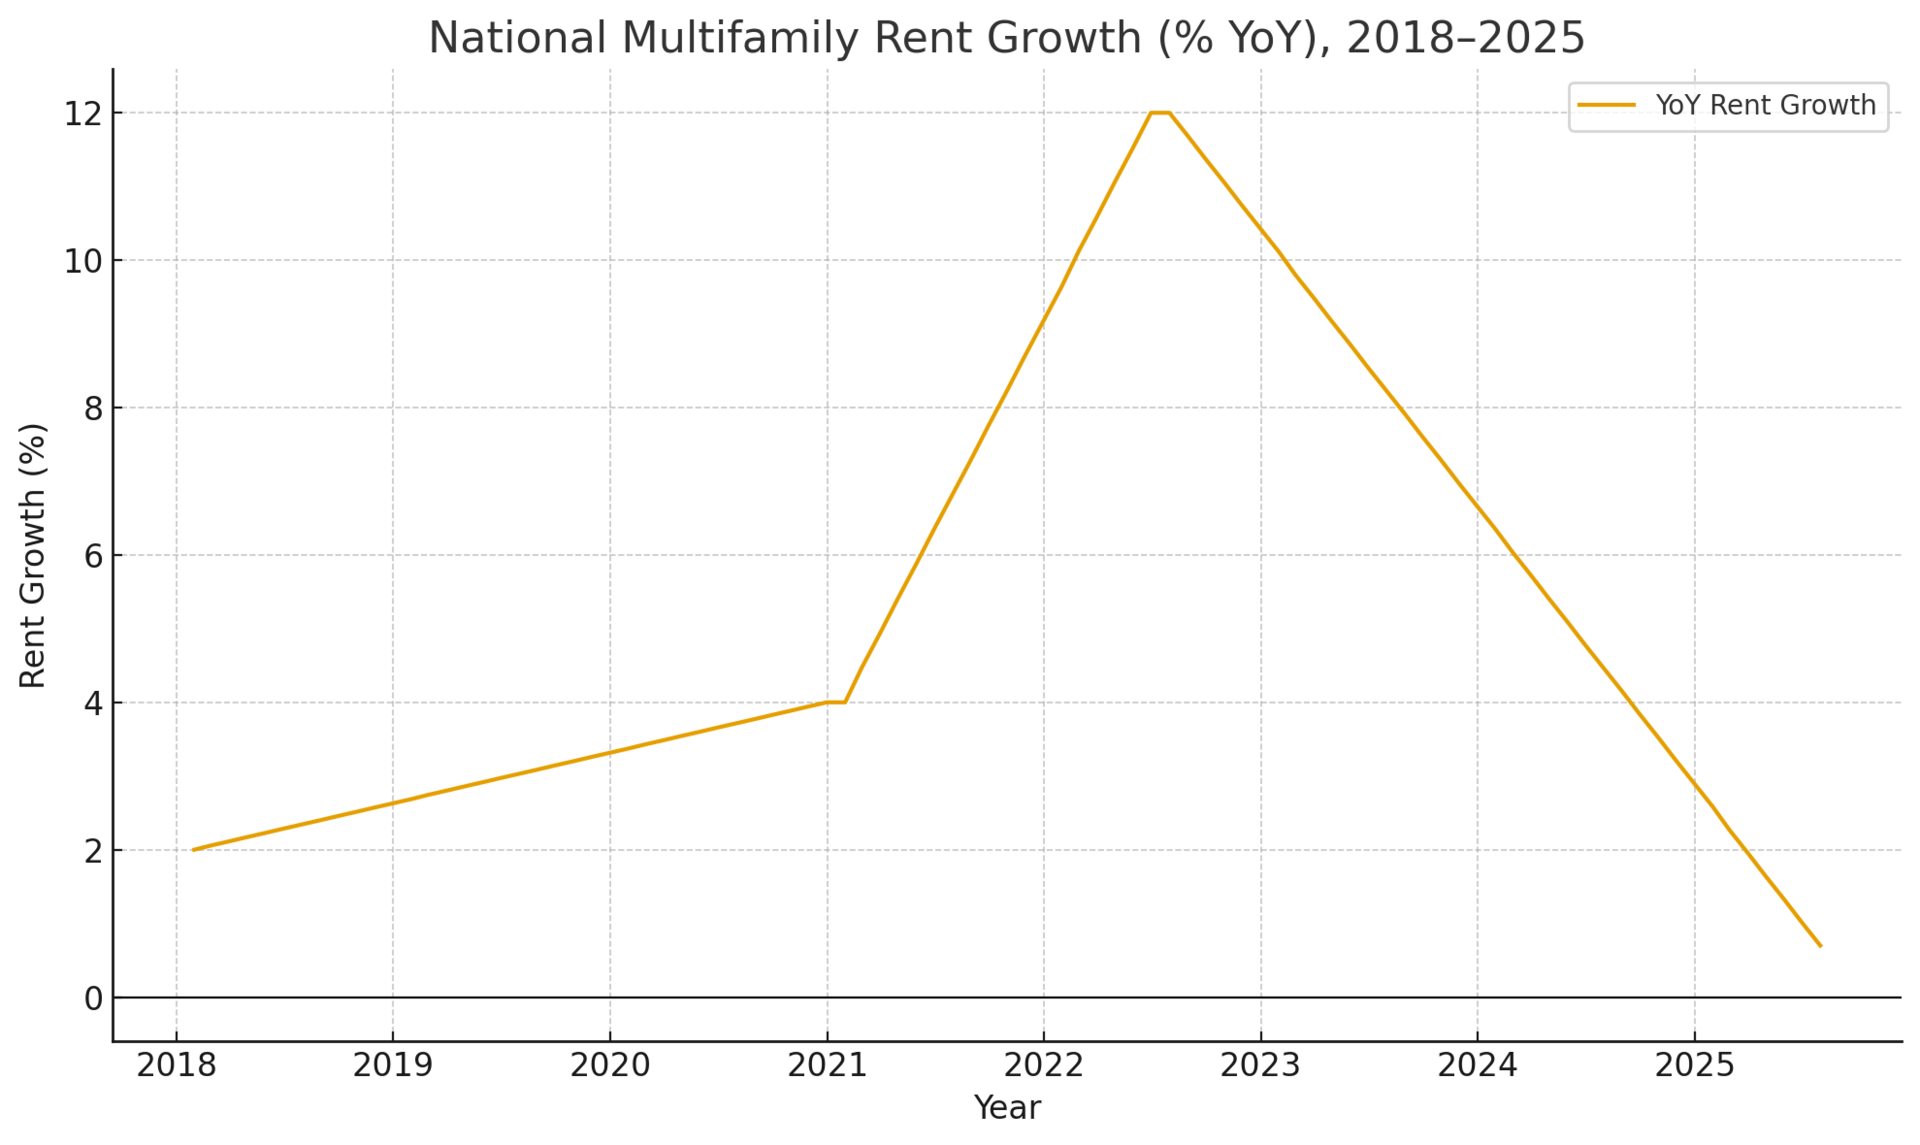
National Multifamily Rent Growth (% YoY), 2018–2025 — shows the surge to ~12% in 2022 followed by a sharp slowdown to ~0% in 2025.

Never miss a Signal
Get the daily brief that busy CRE professionals rely on.