


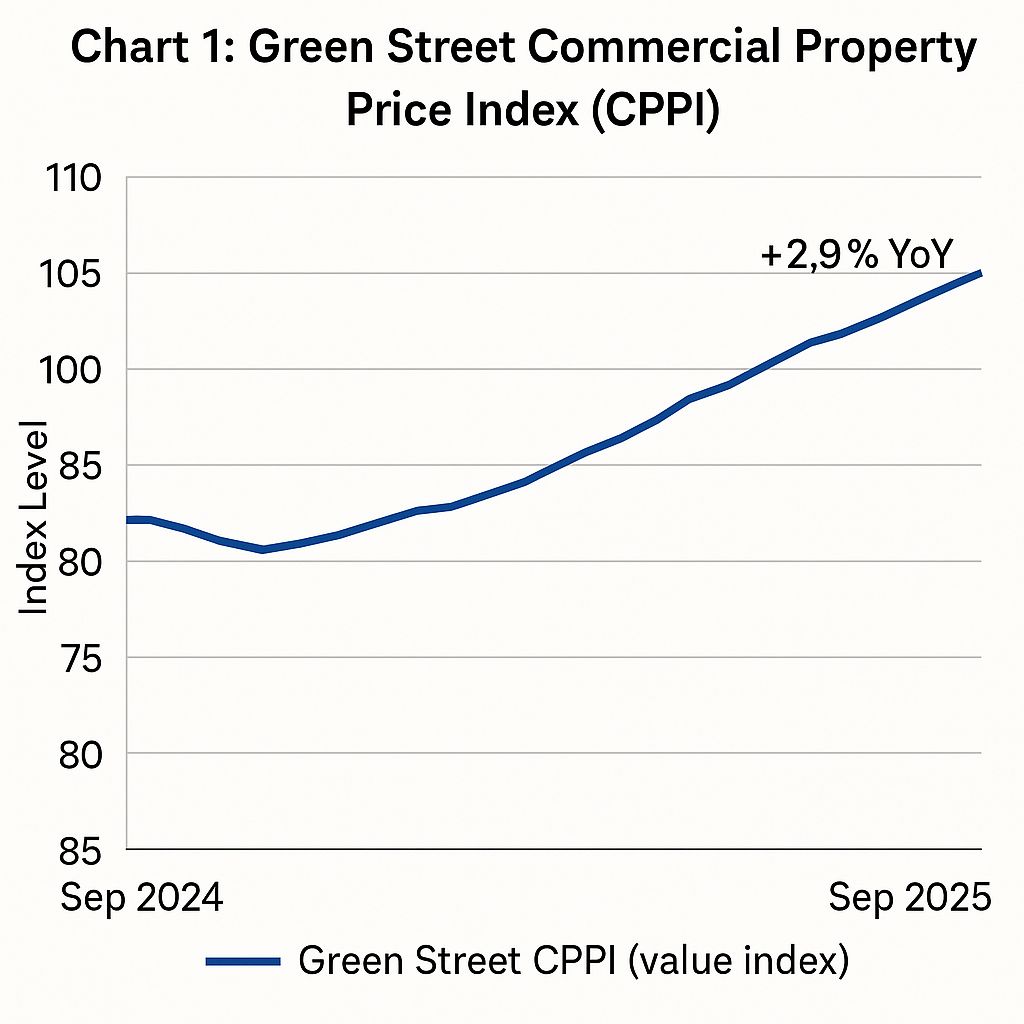
🚨U.S. commercial property values appear to have bottomed. Green Street’s all-property Commercial Property Price Index rose +0.2% in September and +2.9% year-over-year [Source: Green Street], its second straight quarterly gain. Deal volume is improving as buyers and sellers align expectations — large-ticket transactions ($25M+) jumped 21% YoY [Source: MSCI/RCA]. Cap rates remain steady near 6.5–7.0%, suggesting price discovery is largely complete. This stability offers clearer underwriting parameters for lenders and equity investors entering Q4.

Green Street CPPI: +0.2% MoM / +2.9% YoY (Sep 2025) — [Source: Green Street].
U.S. CRE Sales ≥ $5M: $163.6 B H1 2025 (+16% YoY) — [Source: MSCI/RCA].
Average All-Property Cap Rate: 6.5–7.0% (Q3 2025, flat QoQ) — [Source: Green Street].
Institutional Asset Values: ~15–20% below 2022 peak — [Source: Green Street].

Loan Performance. With stabilized valuations, lenders can better gauge collateral; DSCR cushions have improved as rate-cut expectations lower forward hedging costs. Cap and floor structures are recalibrating to normalized yield curves.
Demand Dynamics. Industrial and multifamily see firm rent trajectories (mid-single-digit YoY growth) while office remains ~25% below pre-COVID pricing. Stable occupancy in essential retail anchors steady NOI.
Asset Strategies. Sponsors are refreshing valuations and advancing deferred capital plans; TI/LC spend aligns to leasing velocity, not speculative growth.
Capital Markets. Banks and insurers selectively re-enter preferred sectors; CMBS conduits price BBB– risk ~10–15 bps tighter WoW as bid-ask spreads narrow.

CRE pricing floor confirmed; values +2.9% YoY.
Industrial & multifamily lead recovery; office lags.
Financing clarity returning; spreads steady.
Expect slow, income-driven appreciation, not cap-rate compression.
🛠 Operator’s Lens
Refi. Stabilized assets can refi with improved LTV clarity; expect 50–75 bps rate relief if Fed cuts continue.
Value-Add. Budget robust CapEx contingencies (10–15%); tie returns to lease-up, not market lift.
Development. Keep pro formas flat (0–2% value growth); watch yield-on-cost vs exit cap parity.
Lender POV. Underwriting at current values reduces uncertainty; banks favor core sectors, moderate leverage (55–60% LTV).

Fed rate-cut path critical — further 25 bps move late Oct could nudge cap rates down 25–50 bps.
Watch cross-border capital inflows and Sunbelt deal momentum for validation of bottoming trend.
Downside risk: economic stall or office re-pricing shock.

Green Street — “Commercial Property Price Index Update” (Oct 6 2025). https://www.greenstreet.com/ MSCI Real Capital Analytics — “U.S. Property Sales Trends H1 2025.” https://www.msci.com/our-solutions/real-assets CBRE Research — “U.S. Market Outlook 2025.” https://www.cbre.com/

Never miss a Signal
Get the daily brief that busy CRE professionals rely on.