


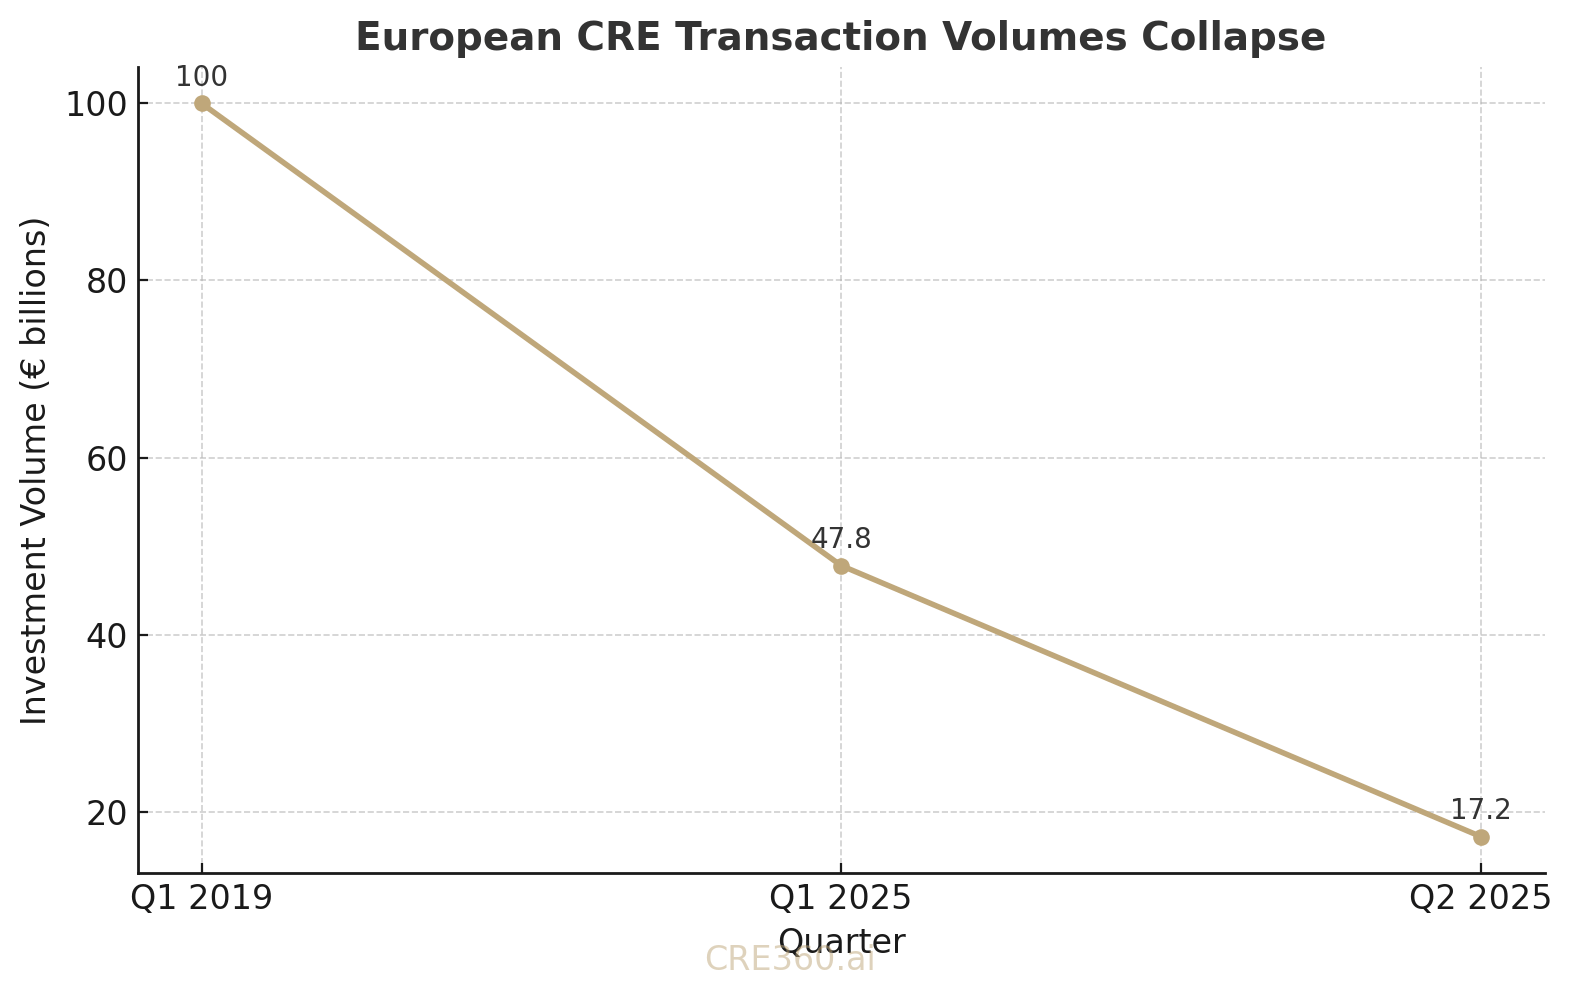
🚨European CRE markets remain stagnant, with Q1 2025 sales at €47.8B – less than half of early 2022 levels. Cross-border EMEA investment plunged 20% YoY in Q2 to €17.2B, the weakest in a decade. Investors increasingly describe a “zombieland” market: minimal liquidity, wide bid-ask gaps, and stranded assets. Capital is flowing to private credit instead, with $39.9B raised for debt funds in H1 vs. $20.6B for property equity. For CRE, this translates to prolonged exits, higher required yields, and lenders demanding stronger DSCR buffers. [Source: Reuters]

European CRE sales: €47.8B in Q1 2025 (–50% vs. 2022).
Cross-border EMEA flows: €17.2B in Q2 2025 (–20% YoY, lowest in 10 years).
Private debt fundraising: $39.9B H1 2025 vs. $20.6B for equity.
Green Street Pan-Europe CPPI: –24% vs. 2022 peak.

Loan Performance. Higher cap rates (+100–150 bps since 2023) and ECB refi at ~4% mean DSCRs are thin. Debt maturities 2025–27 will force deleveraging or equity infusions.
Demand Dynamics. Rental housing and logistics remain resilient (95%+ occupancy), while secondary offices and retail face structural obsolescence. Effective rents in weak office markets are slipping once incentives included.
Asset Strategies. Conversion studies (office→residential/student housing) and modest capex (facade, lighting) can prevent deeper write-downs. Opportunistic interim uses can sustain NOI until liquidity returns.
Capital Markets. Debt dominates new fundraising, with equity sidelined. Lenders limit LTVs to 50–60% and widen spreads. CMBS is effectively shut. Distressed sales like Frankfurt’s Trianon tower will set benchmarks.

Deal volumes near GFC lows; no clear floor yet.
Housing/logistics favored; secondary office/retail stranded.
Financing scarce; banks extend/pretend, debt funds fill gaps.
Spreads elevated, underwriting must assume higher yields.
🛠 Operator’s Lens
Refi. Model DSCR >1.2× even with +100 bps rate stress; assume partial equity paydowns.
Value-Add. Advance entitlements for future conversions; preserve cash, defer non-essential capex.
Development. New starts risky unless pre-leased; underwrite with 6–8% going-in yields minimum.
Lender POV. Banks cautious, pushing risk to debt funds; mezzanine/bridge capital priced at high teens IRRs.

ECB rate cuts could catalyze re-entry by 2026.
Distress sales (e.g. Trianon, CityPoint) may reset values.
Expect another 5–10% slide in all-property indices through mid-2026 before stabilization.

September 28, 2025. Reuters; Green Street; INREV; Preqin. Reuters/MSCI transaction dataset. Preqin fundraising dataset.
showing the share of B/C office properties with ≥10% cap rates declining from 74% in H2 2024 to 71% in H1 2025.

Never miss a Signal
Get the daily brief that busy CRE professionals rely on.