


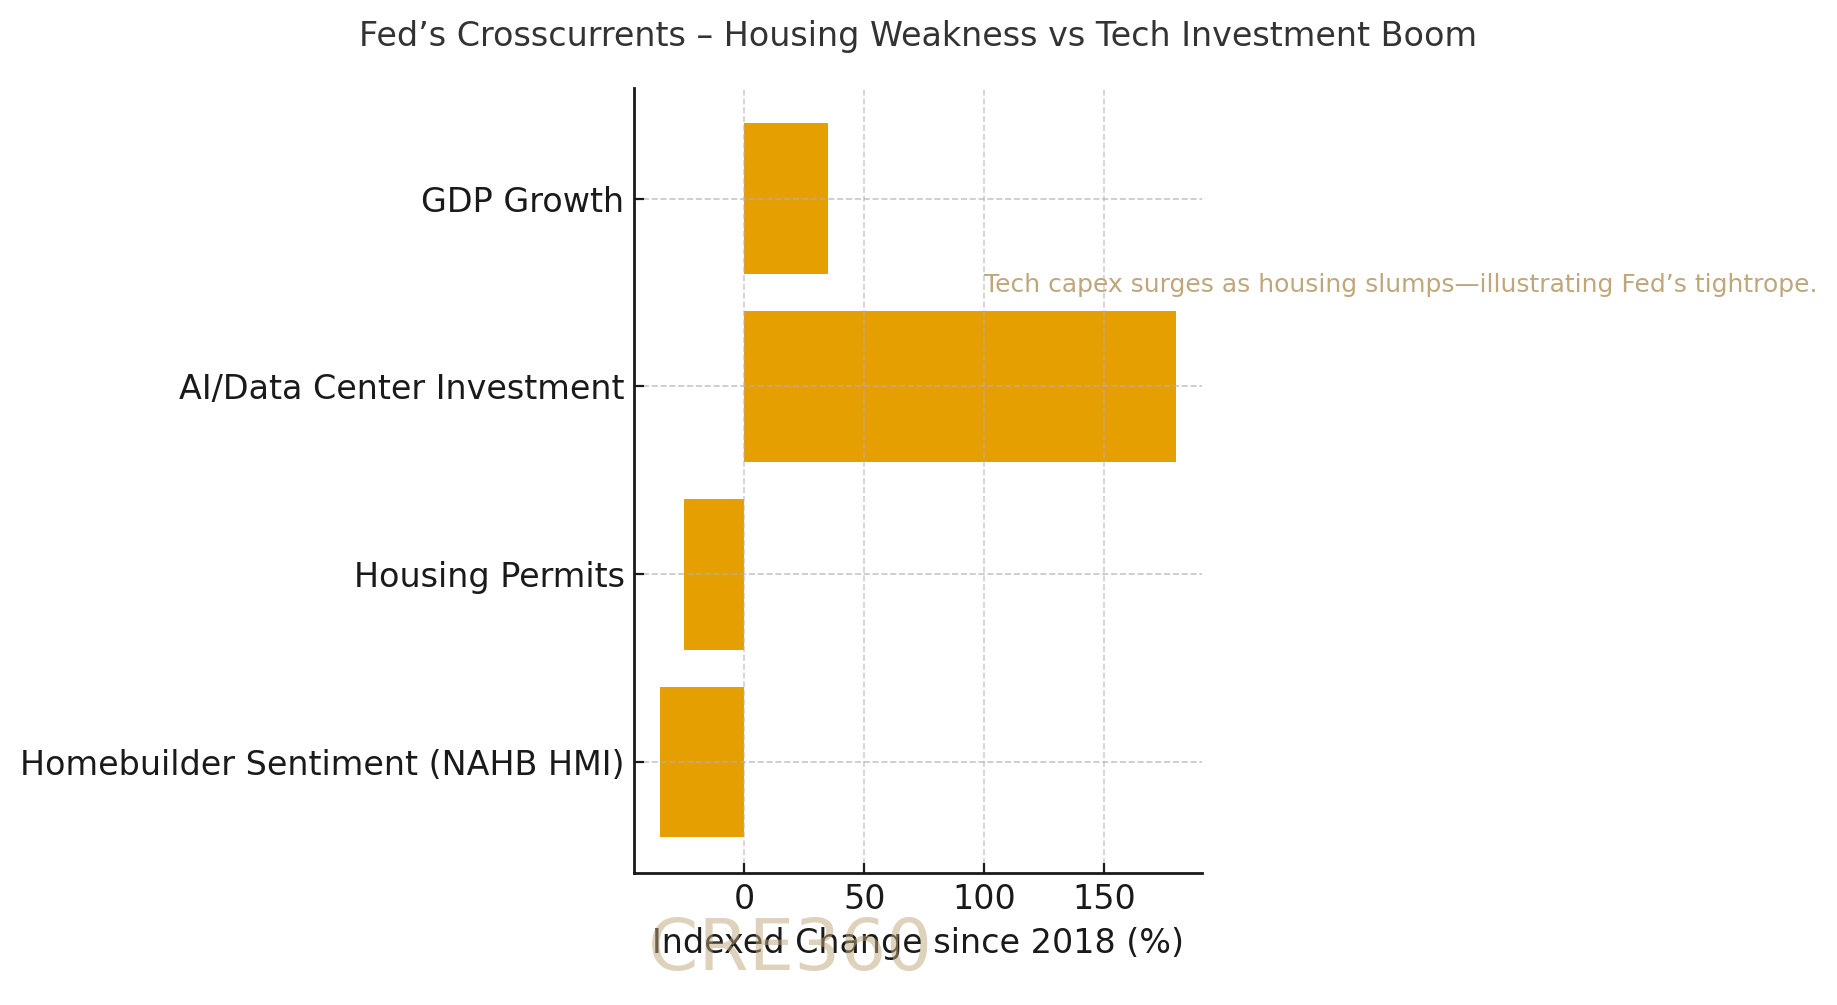
🚨A powerful AI-led investment surge is colliding with weakness in housing and commercial real estate, creating a policy bind for the Federal Reserve. Tech-related capital spending is driving GDP growth near 3.8%, while homebuilder sentiment and permits slump to multi-year lows. Core PCE inflation remains around 3%, forcing the Fed to keep policy tight despite real-estate pain. For CRE, the “higher-for-longer” stance locks in elevated cap rates, wide spreads, and scarce liquidity, with capital increasingly rotating toward tech-linked assets.

Core PCE Inflation: 3.0% YoY (Aug 2025) — [Source: The Edge Malaysia].
10-Year Treasury Yield: 3.8%–4.3% range (Sept 2025) — [Source: FRED].
Green Street CPPI: –17% from 2022 peak (all-property) — [Source: Green Street].
Homebuilder Sentiment (NAHB HMI): 32 (Sept 2025, lowest since 2023) — [Source: Trading Economics].

Loan Performance. Higher base rates compress DSCRs; office and housing maturities face refinancing at ~2× original coupons. Floating-rate borrowers remain most vulnerable absent rate relief before 2026.
Demand Dynamics. Industrial and data-center absorption stay strong on AI-linked demand; housing and office show falling pre-lease and slower rent roll. Concessions widen in suburban markets.
Asset Strategies. Operators trim non-essential capex, stretch TI/LC sequencing, and focus on in-place NOI. Value-add deals emphasize shorter holds and flexible exit paths.
Capital Markets. CRE debt costs stay elevated: SOFR ~5% + 250–300 bps. CMBS pipelines thin; lenders favor industrial/logistics with long leases to credit tenants.

Fed bias: hawkish until inflation < 2%.
Tech-aligned sectors (industrial, data centers) outperform rate-sensitive housing/office.
Financing remains expensive, liquidity selective.
Spreads wide; structure flexibility critical.
🛠 Operator’s Lens
Refi. Underwrite no rate cuts ≤ 12 months; size reserves for +50–100 bps above forwards.
Value-Add. Fund capex from cash flow; keep ≥ 10% contingency.
Development. Stress exit caps ± 50 bps; model delays in lease-up.
Lender POV. Banks favor “New Economy” assets; office/housing loans limited to low LTV extend-and-pretend structures.

Fed likely on hold through early 2026; cuts only if core inflation < 2.5%.
CRE refi wave (2025–26) to test lender patience; expect more extensions than sales.
Watch CPI and PCE for pivot clues; a tech-sector slowdown could trigger policy easing and reprice CRE quickly.

Reuters — “Fed Caught Between Tech Boom Inflation and Real Estate Weakness” (Oct 1 2025). https://www.reuters.com The Edge Malaysia — Analysis of U.S. Macro Divergence (Oct 1 2025). https://www.theedgemalaysia.com Investors Observer — AI Investment Data (Q3 2025). https://www.investorsobserver.com Green Street — Commercial Property Price Index (Sept 2025). https://www.greenstreet.com FRED — 10-Year Treasury Yield (DGS10). https://fred.stlouisfed.org

Never miss a Signal
Get the daily brief that busy CRE professionals rely on.