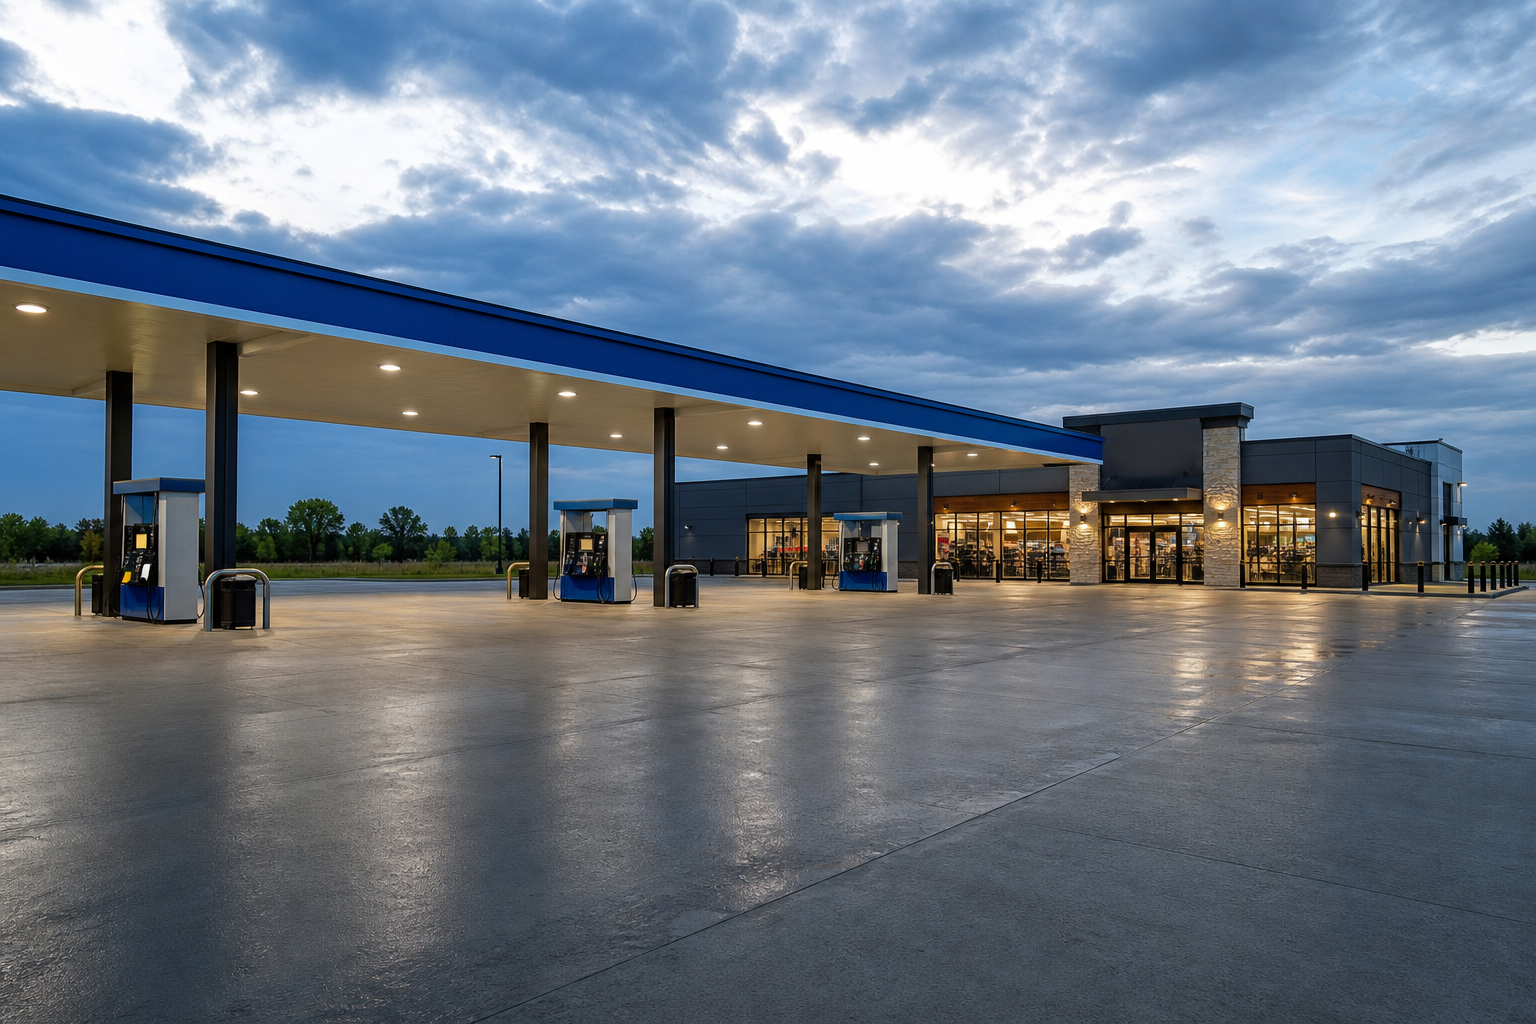
The average convenience-store cap rate was 5.63% in Q2 2026 versus 5.57% a year earlier. The average closed sale was $4.6M, about $1,400 per sf. Sites that sold for $1.5M-$2M seven years ago now trade for $4M-$5M. Getty Realty's $260.9M sale-leaseback of 41 Refuel stores is the largest 2026 deal, about $6.4M per store (derived).
At 5.63%, a $4.6M sale implies about $259,000 of NOI (derived). Bisnow describes the cap rate as about 50 bps over the 10-year, but with the 10-year now at 5.3% the spread on the Q2 cap rate is about 33 bps (derived). The Q2 print predates the rate move.
Top-decile operators generated seven times the food service sales of bottom-decile operators in 2025, and 100% bonus depreciation, enacted in July 2025, is cited as a major driver of investor returns. The real estate is tied to the operator.
Implications: A cap rate priced against a lower Treasury must reset or the buyer accepts negative leverage. Lenders should underwrite the operator and non-fuel sales, not fuel margin. Tenant credit improves only where the buyer is a chain.
Related coverage
Key Takeaways
- The cap rate on a gas station is a bet on the sandwich, the lease guarantee and the tax code.
- The Q2 cap-rate spread to Treasuries is thinner today than the source states.
Bisnow, Oct. 1, 2026 · CRE360 analysis: NOI, per-store and spread figures derived. Cap-rate series is Q2; price per sf likely reflects site area. Fuel-price explanation (Iran supply shocks) is the source's. Single source.
Never miss a Signal
Get the daily brief that busy CRE professionals rely on.