

📢 Good morning,
U.S. office vacancy hit a record ~20.6–20.7% in Q2 2025, even as leasing demand stabilized and top markets like New York posted positive absorption. Supply is finally correcting: planned conversions/demolitions (~23M SF) will exceed new office construction in 2025, and adaptive-reuse pipelines are surging. The market remains bifurcated, with trophy and AI-adjacent nodes firming while commodity space lags.

Vacancy: 20.6–20.7% (Q2 2025, U.S.) — sixth straight quarterly high.
Absorption: –2.0M SF (Q2) vs –7.0M SF (Q1); NYC and select Sunbelt markets turned positive.
Utilization: Kastle weekly utilization hit new post-pandemic highs in early 2025; peak-day occupancy trend rising.
Stock removal: >23M SF slated for conversion/demolition in 2025, surpassing new-build deliveries.
Conversions: ~70.7k apartments from office adaptive reuse expected in 2025.
NYC datapoint: Manhattan availability 17.5% (–50 bps QoQ), +2.17M SF Q2 absorption.
Metric (Q2’25) | U.S. | Notable Market |
|---|---|---|
Vacancy | 20.6–20.7% | Manhattan availability 17.5% |
Net absorption | –2.0M SF | NYC +2.17M SF |
Conversions/Demos 2025 | >23M SF | — |
Office→Apt units 2025 | ~70.7k | NYC, DC, Chicago lead |

Returns / Performance Trends
Income resilience is concentrated. Trophy assets in gateway and AI-led submarkets are setting high-water rents, while Class B/C downtown stock faces persistent concessions. At the national level, vacancy’s new peak signals more value discovery ahead, but quarter-to-quarter absorption is less negative, indicating late-cycle bottoming for higher-quality space.
Lending / Capital Conditions
Debt remains selective. Office spreads price wide, and proceeds are conservative, but refinance windows exist for stabilized, credit-tenant assets. Legacy loans with NOI erosion are pushing delinquency metrics higher in CMBS; lenders favor extensions, mods, or partial paydowns over fire sales while waiting for utilization gains to translate into leasing.
Transaction Activity & Investor Flows
Deal flow is thin but not frozen. Prime refis and recapitalizations clear, often via SASB or insurer balance sheets. Opportunistic equity targets discounted Class A in tech and AI corridors (e.g., San Francisco), where leasing pipelines are reforming and replacement costs are prohibitive.
Broader Implications
The supply side is finally helping: with conversions/demolitions outpacing new starts, obsolescence is being removed, supporting a slow rebalancing. Adaptive reuse to housing is material in 2025, especially in prewar and 1960s–1980s towers with convertible floorplates. Expect continued K-shaped outcomes across metros and vintages.

Vacancy record: ~20.7% confirms oversupply, but quarterly absorption improved vs. Q1.
Removal > addition: >23M SF of office set to be converted or demolished in 2025, finally shrinking obsolete stock.
Reuse surge: ~70.7k units from office-to-resi this year → structural demand release for CBDs.
NYC stabilizing: Availability 17.5%, +2.17M SF Q2 absorption → leading indicator for top-tier markets.
Selective demand: AI and trophy corridors show lease momentum; commodity space lags.
Institutional Lens: Underwrite office with low- to no-growth NOI through 2026 except in proven, amenitized submarkets. For refinance candidates, target ≤55–60% LTV, strong rollover schedules, and pre-arranged TI/LC reserves. Consider capital for conversion or densification where floorplates, cores, and zoning align.
Operator’s Lens: Aggressively curate tenancy. Stack expirations away from 2026–27 bulges, pre-commit anchor renewals, and forward-buy TI/LC. If a building is structurally off-market (deep floors, obsolete MEP), model reuse pathways now; RFP design teams while incentives remain available.

Near term: Flat-to-slightly negative national absorption through early 2026; trophy/super-core pockets outperform.
Supply correction: More conversions and selective demolitions support gradual vacancy cresting in 2026. Demand signals: Track Kastle utilization and large corporate RTO policies; sustained >55% utilization would precede firmer leasing.
Market watch: NYC trajectory, SF AI leasing, and sublease withdrawals as leading indicators.

Moody’s Analytics; CBRE; JLL; Kastle Systems; RentCafe; WSJ — CRE360 Signal Staff. Moody's CRECalculated RiskCBREJLLKastle SystemsRentCafeThe Wall Street Journal
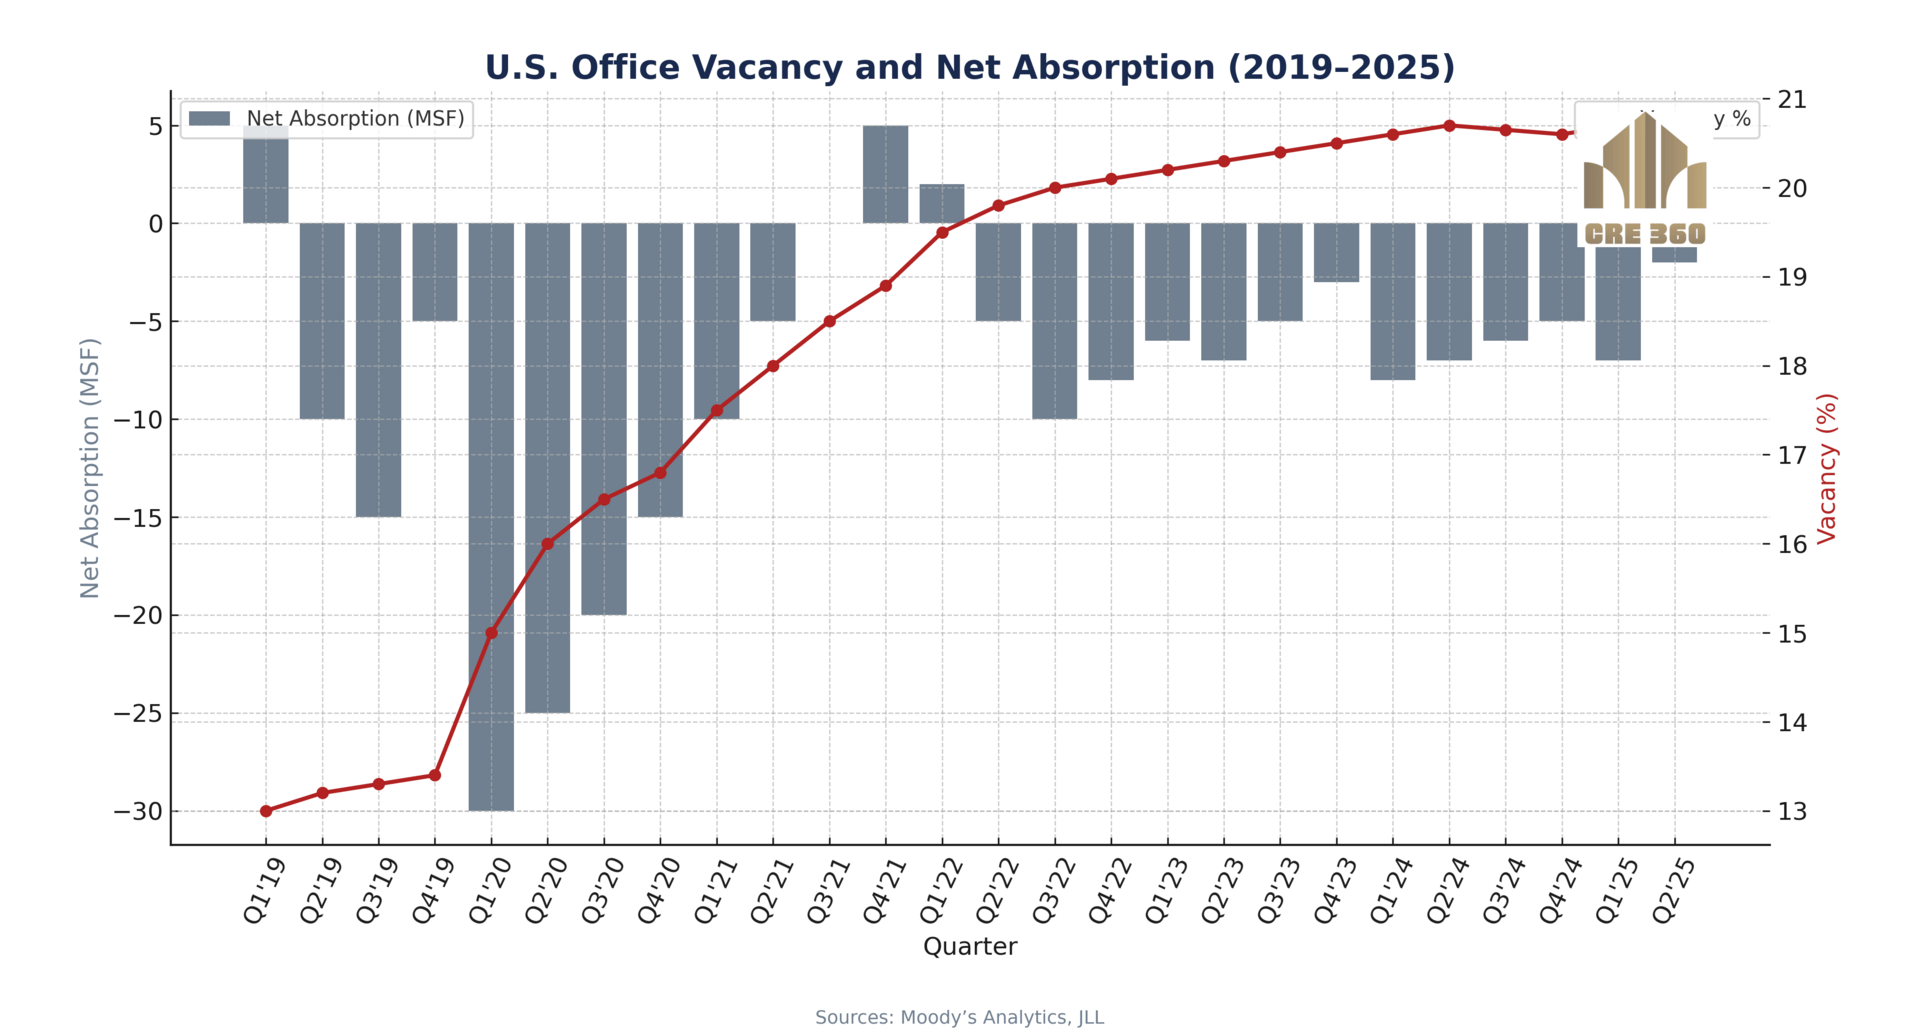
Chart 1 – U.S. Office Vacancy and Net Absorption (2019–2025).
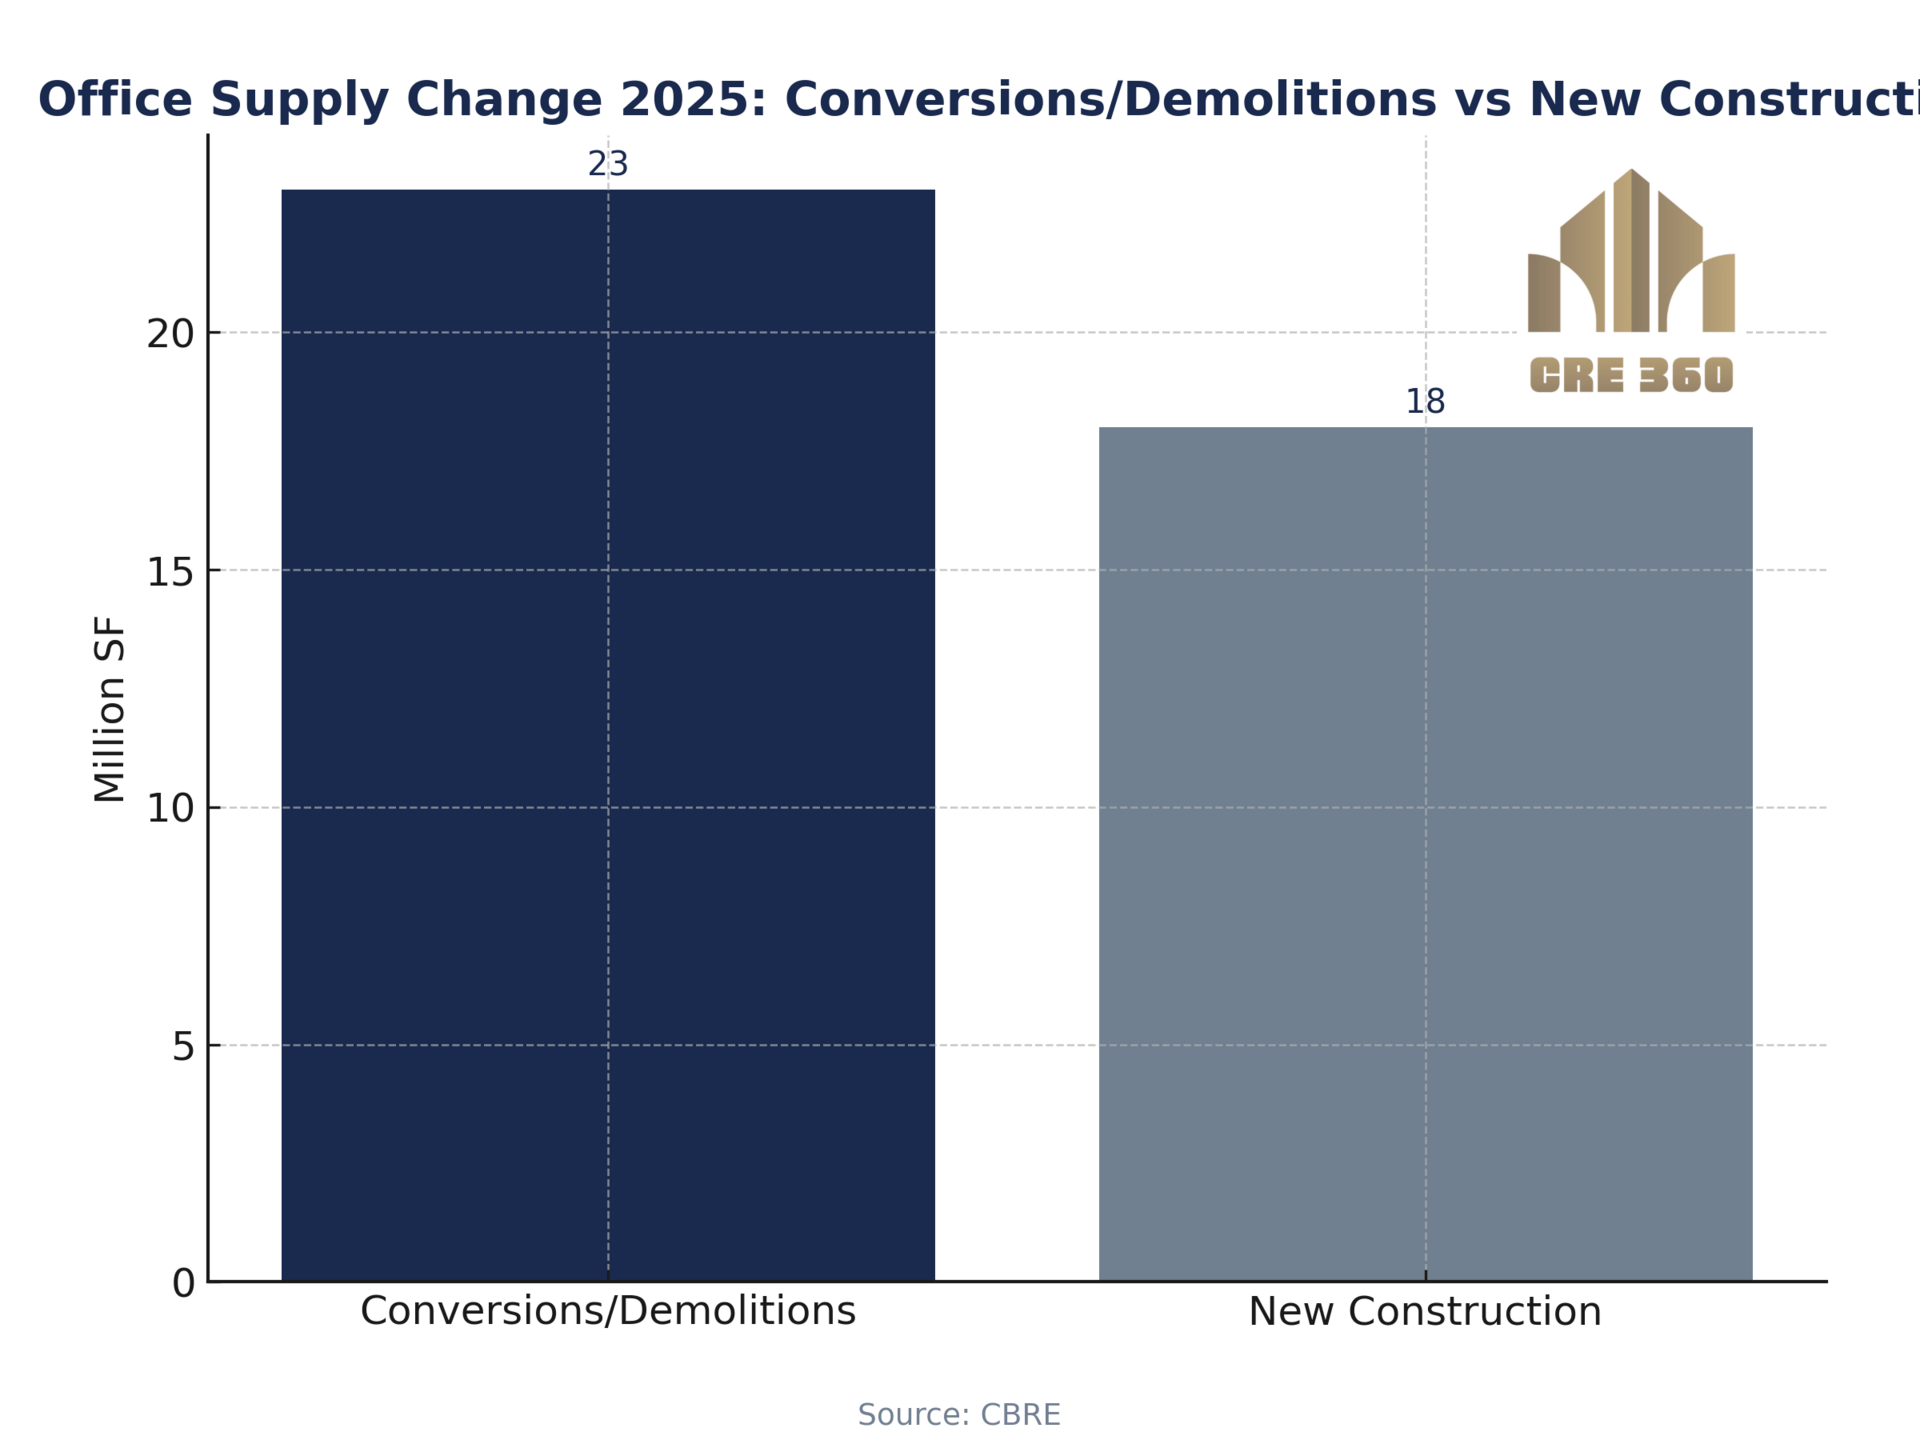
Chart 2 – Office Supply Change 2025 (Conversions/Demos vs New Construction)

Never miss a Signal
Get the daily brief that busy CRE professionals rely on.